Showing posts with label wages. Show all posts

Thursday, March 14, 2024

What You Need to Know About the Gender Wage Gap

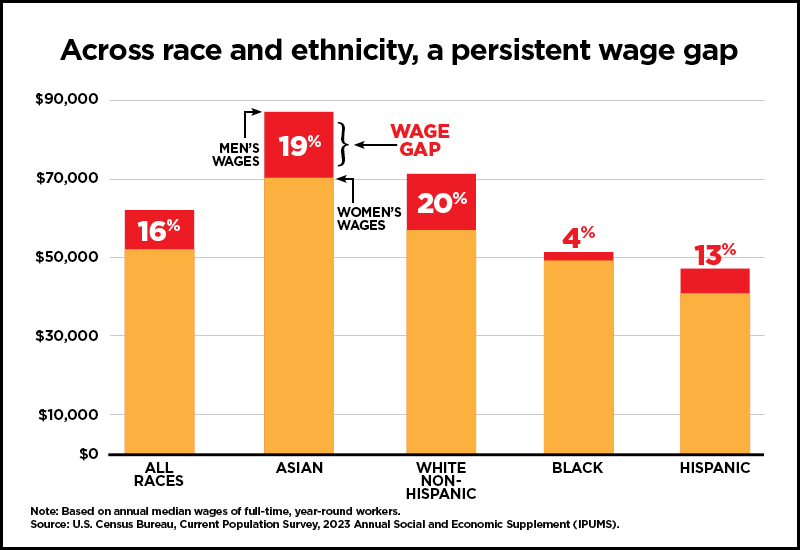
"Bar graph title: Across race and ethnicity, a persistent wage gap. A graph depicting the wage gap between race and gender compared to the average white male: All races - 16%; Asian - 19%; White Non-Hispanic - 20%; Black - 4%; Hispanic - 13%.

March 12 is Equal Pay Day – which represents the date into the year women must work in order to earn the same amount as the average man the previous year. But what does that mean? And what can we say about the gender wage gap today? 

Here are five fast facts: 

  • Overall, women are paid less than men. On average, women working full-time, year-round are paid 84% of what men are paid. In other words, the typical woman working full-time would need to work from January 1, 2023, until March 12, 2024, to make what the typical man working full-time made in 2023. This wage gap also persists within all major race and ethnic groups. For instance, Hispanic women ($41,137 median annual salary) make 13% less than Hispanic men ($47,420 median annual salary). This inequity is even greater for Black and Hispanic women when compared to white, non-Hispanic men.   

  • The largest identifiable causes of the gender wage gap are differences in the occupations and industries where women and men are most likely to work. In 2023, Black women lost $42.7 billion and Hispanic women lost $53.3 billion in wages as compared to white men due to the impact of occupational segregation. However, even within the same occupation, women make less on average than men. 

View our new fact sheet on lost wages due to occupational segregation for Black and Hispanic women.

  • A woman must complete at least one additional educational degree to earn as much as a man with less education. For instance, on average, a woman with an advanced degree earns less than a man with a bachelor’s degree. Were it not for the fact that women attain a greater number of degrees than men, the gender wage gap would be even larger. 

  • The wage gap is larger for mothers and results in employment-related losses of more than $295,000 over a lifetime. This results in women having lower average incomes in retirement and less financial stability in old age. 

  • Discrimination remains a likely leading cause of the gender wage gap. Just since Fiscal Year 2022, the Department of Labor’s Office of Federal Contract Compliance Programs, the Equal Employment Opportunity Commission and the Department of Justice have collectively recovered over $20 million in monetary relief for women who have experienced pay discrimination in the workplace... 

View our Equal Pay webpage..."
Gender Wage Gap 

Wednesday, April 6, 2022

Five Facts About Davis-Bacon and Related Acts

"With President Biden’s signing of the Bipartisan Infrastructure Law on Nov. 15, 2021, our nation is poised to address our aging infrastructure and at the same time create an estimated 800,000 good paying jobs in construction and related industries. Most of the construction projects funded or assisted through the Bipartisan Infrastructure Law will be subject to Davis-Bacon prevailing wage labor standards. That means construction workers on these projects must be paid at least the locally prevailing wage and fringe benefits required for the work they perform...

  1. Davis-Bacon is a federal law that requires local prevailing wages be paid on most federal and federally funded construction contracts. The Davis-Bacon Act ensures that federal government funds elevate labor standards for construction workers across the country, and that taxpayer dollars are used to ensure local wage and benefit standards, allowing responsible contractors to compete for federally funded or assisted construction contracts.

  2. If it’s a Davis-Bacon project, it requires Davis-Bacon wages. Construction workers working on Davis-Bacon covered construction contracts must be paid no less than the locally prevailing wages for all hours worked in each labor classification. If a construction worker on a Davis-Bacon project works in more than one labor classification, the contractor or subcontractor must pay the highest applicable wage rate for all hours worked or different wage rates based on the actual hours worked in each labor classification. Local wage determinations that list labor classification and wage rates are issued by the Wage and Hour Division of the U.S. Department and can be found at sam.gov.

  3. Understand the wages owed to construction workers. Contractors and subcontractors on Davis-Bacon projects must pay their construction workers not less than the wages and fringe benefits listed on the wage determination for the work performed. To help ensure workers are paid the proper rates, workers, contractors and subcontractors should familiarize themselves with:

    1. where the work is being performed,

    2. the type of construction (building, residential, highway, or heavy), and

    3. the applicable labor classifications for the work being performed..."
      Davis-Bacon Act
       

Wednesday, March 30, 2022

Honoring and Protecting Farmworkers, Always Essential

"Our Wage and Hour Division has prioritized agricultural stakeholders throughout its ongoing Essential Workers – Essential Protections outreach initiative. These efforts will continue beyond this week with outreach events in English and Spanish for farmworkers, advocates and employers. We’ll be educating agricultural stakeholders on essential worker protections we enforce, such as:

Farmworkers deserve to live in safe and sanitary housing. And the vehicles used to transport these workers must be maintained in safe operating conditions. When farmworkers’ safety is at risk, the Wage and Hour Division will not hesitate to act, as evidenced by our recent investigation in Missouri and another in Idaho.

We are equally dedicated to protecting farmworkers who are victims of human trafficking. As a partner in the National Action Plan to Combat Human Trafficking, the department works aggressively with other federal law enforcement agencies to bring labor traffickers to justice, as we did recently in Georgia.

Over the past three years, the Wage and Hour Division has recovered over $21.5 million in wages owed to agricultural workers and assessed over $20 million in civil money penalties against employers, including those who intentionally or repeatedly failed to comply with the law, pay workers their hard-earned wages and ensure their housing and transportation safety. We use every available tool, including litigation, to protect workers from harassment, abuse and retaliation for asserting their rights. Agricultural workers are at higher risk for exploitation for several reasons, such as the migratory and seasonal nature of the work, their reliance on employer-provided housing, the physical demands of the job and typically low wages..."
Farm workers 

Tuesday, January 17, 2017

Working in Workplace Safety

"Ensuring safe and healthy workplaces is a top priority of the Labor Department. It’s also a smart career path for people interested in making sure offices, factories, mines and other workplaces are safe from hazards and adhere to regulations concerning health, safety and the environment.
The median wages for all of these jobs are also higher than the median wage for all occupations ($36,200). Here’s a closer look at nine options (chart text available below):..."
Workplace safety


Monday, November 28, 2016

Highlights of women’s earnings in 2015

"In 2015, women who were full-time wage and salary workers had median usual weekly earnings that were 81 percent of those of male full-time wage and salary workers. In 1979, the first year for which comparable earnings data are available, women’s earnings were 62 percent of men’s. Since 2004, the women’s-to-men’s earnings ratio has ranged from 80 to 83 percent. (See chart 1 and tables 1 and 12.)
This report presents earnings data from the Current Population Survey (CPS), a national monthly survey of 60,000 eligible households conducted by the U.S. Census Bureau for the U.S. Bureau of Labor Statistics (BLS). The weekly and hourly earnings estimates in Highlights of Women’s Earnings reflect information collected from one-fourth of the CPS monthly sample and averaged for the calendar year. These data are distinct from the annual earnings estimates for full-time, year-round workers collected separately in the Annual Social and Economic Supplement (ASEC) to the CPS and published by the U.S. Census Bureau..."
Women's wages

Monday, September 12, 2016

Education, training, and library occupations in May 2015

"In May 2015, there were about 1.4 million elementary school teachers, excluding special education—the largest occupation among teachers. These teachers had an average annual wage of $57,730. Excluding special and career/technical education, there were 963,000 secondary school teachers and 633,000 middle school teachers. Secondary school teachers earned an average annual wage of $60,440 and middle school teachers earned $58,760..."
Teacher salaries

Wednesday, September 30, 2015

Measuring wage inequality within and across U.S. metropolitan areas, 2003–13

"Rising wage inequality in recent years has brought increased focus on the disparity between the highest wage earners and the lowest wage earners. Less attention, however, has been paid to how wage inequality varies by location or area. By one measure—the ratio of the 90th wage percentile to the 10th wage percentile, sometimes called the “90–10” ratio, inequality increased by 7 percent in the United States between 2003 and 2013. But this increase varied widely by area. The 90–10 ratio increased by over 20 percent in Oakland, CA, and Corvallis, OR, for example, while it declined in several other metropolitan areas in the United States, including three areas in Florida. This article examines how wage inequality varies by metropolitan area and how average wages, occupational composition, geographic location, and the size of the area contribute to the variation in this inequality measure..."
Wage inequality

Thursday, June 11, 2015

A look at pay at the top, the bottom, and in between

"Policymakers and the public have given much attention to economic inequality in the past few years. In general terms, inequality refers to the differences between people with the highest levels of wealth, income, or earnings and those with the lowest levels. How big are these differences? Have they grown over time? What other ways do these groups differ besides how much money they earn?


This Spotlight on Statistics looks at measures of earnings and wages. The Spotlight examines how these measures have changed over time and how they differ within a geographic area, industry, or occupation. The Spotlight also looks at how participation in employee benefit plans differs across wage categories. Finally, the Spotlight looks at how people in different income or earnings categories spend their time and their money..."
Wages and pay


Thursday, February 5, 2015

Wage Data by Area and Occupation


Find wage data by occupations for the United States, regions, states, and local metropolitan areas.
wages and occupations

Thursday, August 14, 2014

A YEAR OF ACTION: PROGRESS REPORT ON RAISING THE MINIUMUM WAGE

Find information of efforts to raise the minimum wage since President Barack Obama called for a raise in his Sate of the Union address in January 2014.
Minimum wage

Tuesday, February 18, 2014

The Effects of a Minimum-Wage Increase on Employment and Family Income

"Increasing the minimum wage would have two principal effects on low-wage workers. Most of them would receive higher pay that would increase their family’s income, and some of those families would see their income rise above the federal poverty threshold. But some jobs for low-wage workers would probably be eliminated, the income of most workers who became jobless would fall substantially, and the share of low-wage workers who were employed would probably fall slightly..."
Minimum wage

Saturday, November 30, 2013

Pay Equity: Legislative and Legal Developments

"The term “pay gap” refers to the difference in earnings between male and female workers. While
the pay gap has narrowed since the 1960s, female workers with a strong attachment to the labor
force earn about 77 to 81 cents for every dollar earned by similar male workers. Studies have
analyzed the earnings and characteristics of male and female workers and found that a substantial
portion of the pay gap is attributable to non-gender factors such as occupation and employment
tenure..." Pay equity

Wednesday, October 30, 2013

Highlights of Women’s Earnings in 2012

"In 2012, women who were full-time wage and salary workers had median usual weekly earnings of $691. On average in 2012, women made about 81 percent of the median earnings of male full-time wage and salary workers($854). In 1979, the first year for which comparable earnings data are available, women earned 62 percent of what men earned..."
Women's earnings

Wednesday, March 6, 2013

Inflation and the Real Minimum Wage: A Fact Sheet

"The Fair Labor Standards Act (FLSA) of 1938 established the hourly minimum wage rate at
25 cents for covered workers.1 Since then, it has been raised 22 separate times, in part to
keep up with rising prices. Most recently, in July 2009, it was increased to $7.25 an hour.
Because there have been some extended periods between these adjustments while inflation
generally has increased, the real value (purchasing power) of the minimum wage has decreased substantially over time..."
Inflation and the Real Minimum Wage

Friday, January 4, 2013

Women’s earnings by occupation, 2011

"In 2011, women working full time in management, business, and financial operations jobs had the highest median weekly earnings of any major occupational category ($977). Within this occupation group, women who were chief executives and computer and information systems managers had median weekly earnings of $1,464 and $1,543, respectively..."
Women's Earnings by Occuation, 2011

Tuesday, October 30, 2012

Highlights of Women's Earnings in 2011

"In 2011, women who were full-time wage and salary workers had median usual weekly earnings of $684, about 82 percent of median earnings for male full-time wage and salary workers ($832). In 1979, the first year for which comparable earnings data are available, women earned 62 percent of what men earned..."
Highlights of Women's Earnings in 2011

Friday, August 24, 2012

2011 Annual Survey of Public Employment & Payroll

"In March 2011, there were 16.4 million full-time equivalent employees working in state and local governments in the U.S., down 1.4 percent from 2010. According to estimates released today by the U.S. Census Bureau, the majority of these employees (8.9 million) worked in education, followed by those working in hospitals (964,381), police protection (923,951) and corrections (717,940)..."

Friday, August 3, 2012

Comparing Compensation for Federal and Private-Sector Workers: An Overview

"Recently there has been significant congressional interest in compensation of the federal civilian
workforce. The increased interest has been driven at least in part by budgetary pressure and in
part by the state of the economy since the recession began in 2007. Issues related to the
compensation of federal employees often center on the pay differential between federal workers
and their private sector counterparts..."

Friday, May 11, 2012

Mother's Day Report: Paycheck Fairness Helps Families no Just Women

"The persistent gap between men's and women's paychecks hurts families and harms the economy. The current gender pay gap is 18 percent; in other words, women earn 82 cents for every dollar earned by men. While the gap has narrowed slightly in recent decades, the repercussions of pay inequality extend far beyond women's pocketbooks: when women are paid less than men for the same work, everyone feels the effects. Without pay fairness, women have less income to help support their families and fewer dollars to spend in their communities. The economy suffers as a result..."

Tuesday, January 31, 2012

Annual Survey of Public Employment and Payroll Summary Report: 2010

Find employment and payroll data for public employees on states, counties, cities,
townships, special districts, and school districts.