Showing posts with label employment. Show all posts

Saturday, September 9, 2023

New BLS Employment Projections: 3 Charts

"When you’re thinking about making a career change, what information do you look for? Most people want to know if that career is growing – is the demand for that type of work increasing or decreasing? Will there be more jobs of that type in the future or fewer?

That’s just one use among many for the employment projections data produced every year by the Bureau of Labor Statistics, or BLS. The employment projections give students, job seekers, workers, employers, researchers, policymakers and others a good idea of how the labor force will change, which industries are likely to see growth, how fast specific occupations will grow and more.

The 2022-2032 employment projections data were released on Sept. 6, showing that the economy is projected to add almost 4.7 million jobs from 2022 to 2032. Here are some of the highlights: 

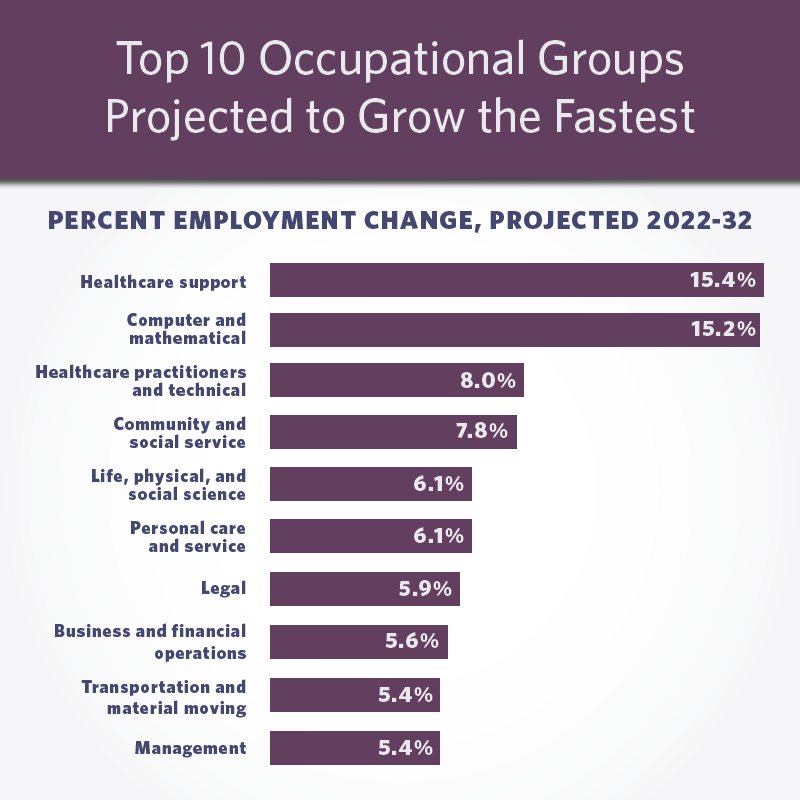
1. Fastest growing occupational groups 

Healthcare growth is being driven by an aging population and a higher prevalence of chronic conditions. Combined with the healthcare practitioners and technical occupational group, healthcare occupations are projected to account for approximately 2 out of every 5 new jobs added to the economy from 2022 to 2032. Demand for information technology products and services are fueling the increase in the computer and mathematical occupational group. Community and social service occupations – including counselors, social workers, and religious workers – are often adjacent to healthcare, so some of this group’s growth will be associated with the robust growth that is expected among healthcare occupations.

Chart showing the top 10 occupational groups projected to grow the fastest from 2022 to 2032. They include healthcare support (15.4%); computer and mathematical (15.2%); healthcare practitioners and technical (8.0%); community and social service (7.8%); life, physical and social science (6.1%); personal care and service (6.1%), legal (5.9%), business and financial operations (5.6%); transportation and material moving (5.4%); and management (5.4%).

Employment Projections 

Monday, December 12, 2016

EEOC Issues Publication on the Rights of Job Applicants and Employees With Mental Health Conditions

"The U.S. Equal Employment Opportunity Commission (EEOC) today issued a resource document that explains workplace rights for individuals with mental health conditions under the Americans With Disabilities Act of 1990 (ADA).
Depression, PTSD, & Other Mental Health Conditions in the Workplace: Your Legal Rights explains that job applicants and employees with mental health conditions are protected from employment discrimination and harassment based on their conditions. They may also have a right to reasonable accommodations at work. Reasonable accommodations are work adjustments that can help individuals to perform their jobs and remain employed. The resource document also answers questions about how to get an accommodation, some types of accommodations, restrictions on employer access to medical information, confidentiality, and the role of the EEOC in enforcing the rights of people with disabilities.
EEOC charge data shows that charges of discrimination based on mental health conditions are on the rise. During fiscal year 2016, preliminary data shows EEOC resolved almost 5,000 charges of discrimination based on mental health conditions, obtaining approximately $20 million for individuals with mental health conditions who were unlawfully denied employment and reasonable accommodations..."
Job rights and mental health

Saturday, December 12, 2015

Employment Projections: 2014-24

"Healthcare occupations and industries are expected to have the fastest employment growth and to add the most jobs between 2014 and 2024, the U.S. Bureau of Labor Statistics reported today. With the increase in the proportion of the population in older age groups, more people in the labor force will be entering prime retirement age. As a result, the labor force participation rate is projected to decrease and labor force growth to slow. This slowdown of labor force growth is expected, in turn, to lead to Gross Domestic Product (GDP) growth of 2.2 percent annually over the decade. This economic growth is projected to generate 9.8 million new jobs—a 6.5-percent increase between 2014 and 2024..."
Employment

Wednesday, August 12, 2015

Statistics of U.S. Businesses (SUSB) Main

"2012 annual or static data include number of firms, number of establishments, employment, annual payroll, and estimated receipts for most U.S. business establishments. The data are tabulated by geographic area, industry, and enterprise size. Industry classification is based on 2012 North American Industry Classification System (NAICS) codes. An establishment with 0 employment is an establishment with no paid employees in the mid-March pay period but with paid employees at some time during the year..."
Business statistics

Monday, August 3, 2015

American Experience vs American Expectations:an Updated Look at Private-sector Employment for Women, African Americans, Hispanics, Asian-Americans...

"American Experiences versus American Expectations illustrates the significant changes to the United States workforce during the 50 years since the Equal Employment Opportunity Commission (EEOC) opened its doors in 1965. The report is an updated look at the groundbreaking 1977 EEOC research Black Experiences Versus Black Expectations. Written by Dr. Melvin Humphrey, EEOC's then-director of Research, Black Experiences versus Black Expectations was the first major EEOC research report to use data collected through the EEO-1 survey to focus on the issue of racial inequality in the workforce. The report's title came from the gap between African American employment experiences in the workforce and expectations based on fair-share employment levels, defined at the time as the number of minorities employed at a rate equal to their employment availability. 

American Experiences versus American Expectations focuses on changes in employment participation from 1966 to 2013 not only for African Americans but also for Hispanics, Asian Americans, American Indians/Alaskan Natives, and women. The participation rate represents the percentage of workers from each demographic group that hold positions in the variety of categories reported in the EEO-1 survey.

Beginning in 1966 all employers with 100 or more employees (lower thresholds apply to federal contractors) have been required by law to file the Employer Information Report EEO-1 with the EEOC. In FY 2013 approximately 70,000 employers filed an EEO-1. These forms indicate the composition of an employer's workforces by sex and by race/ethnic category..."
American experiences

Saturday, June 6, 2015

An Overview of the Employment-Population Ratio

"The Bureau of Labor Statistics (BLS) defines the employment-population ratio as the ratio of total civilian employment to the civilian noninstitutional population. Simply put, it is the portion of the population that is employed. The ratio is used primarily as a measure of job holders and to track the pace of job creation, relative to the adult population, over time.
The employment-population ratio has several properties that make it an attractive indicator for labor market analysis. It is easy to interpret and can be used to make meaningful comparisons across time and groups with dissimilar population size. Because it takes into account both the impacts of labor force participation and unemployment, it is a useful summary measure when those forces place countervailing pressures on employment. Like all labor market indicators, it has limits. For example, it does not distinguish between part-time and full-time employment, and it is silent on wages, benefits, and job conditions. Trends in the employment-population ratio also do not provide information about job flows (i.e., whether a drop in employment represents more people exiting employment or fewer new entrants).."
Employment and population

Thursday, April 9, 2015

Six million graduates employed in science and engineering in 2013

"The number of college graduates in the United States nearly doubled between 1993 and 2013, according to a new report from the National Science Foundation's National Center for Science and Engineering Statistics.

The report details that the number of graduates with degrees in science and engineering (S&E) fields grew faster than the number of those with other types of degrees. In 2013, 27 percent of graduates held degrees in S&E fields. Roughly 1 in 10 graduates were employed in S&E occupations, a proportion that has remained largely unchanged since 1993..."

Science and Engineering employment

Wednesday, November 19, 2014

In the Shadow of the Great Recession: Experiences and Perspectives of Young Workers

"Young adults in the United States have experienced higher rates of unemployment and lower rates of labor force participation than the general population for at least two decades. The Great Recession exacerbated this phenomenon. Despite a substantial labor market recovery from 2009 through 2014, vulnerable populations—including the nation’s young adults—continue to experience higher rates of unemployment..."

Young workers and recession

Tuesday, November 11, 2014

Employment Status and Occupations of Gulf War-Era Veterans

"The focus of this analysis is on veterans who served on  active duty in the U.S. Armed Forces only from August  1990 or later.
Gulf War-era veterans who served since 1990 are the  most recent cohort of wartime veterans and make up  about 35 percent of the current working-age veteran  population (see Figure 1).2 They are also a large and  growing segment of the veteran population, making  them a cohort of particular interest, but about which  minimal economic research has been done. Much of  the past research on post-military economic outcomes  of wartime veterans focused on Vietnam-era and  World War II veterans. Very few, if any, World War II and  Korean War veterans are still in the labor force—none  are in the working-age population defined here—and  the majority of the Vietnam-era veterans are nearing
retirement age..."
Veterans employment

Tuesday, October 14, 2014

Housing: Before, During, And After The Great Recession

"As the 2000s unfolded, economic growth and public policies designed to increase homeownership led to a housing boom. By 2006, the “housing bubble” began to burst. In late 2007, the economy fell into recession. The housing market continued to soften, people began to lose their jobs, and the banking industry was in crisis.
This Spotlight on Statistics looks at consumer expenditures on household items, employment in residential construction and housing-related industries, prices for household items and commodities, and injuries in occupations involved in building and maintaining our homes.."

Housing statistics

Saturday, September 6, 2014

5 Things You Need to Know About Women and the Economy

"Today’s employment report underscores the fact that the economy is continuing to recover, and employment is continuing to increase. Women have shared in these gains, with female employment increasing by 4.1 million jobs in the last 54 months, and the fraction of discouraged workers and workers experiencing long-term unemployment continues to fall. Across industries, women’s employment gains look relatively similar to previous periods of strong employment growth. To further support the economy, and to ensure the workplace works for the 21st century economy, the President is encouraging Congress to act and using his own executive action to support policies that support a fair workplace for all workers -- including women..."
Women and the economy

Friday, May 23, 2014

Women in the Labor Force: a Databook, 2014

"This report presents historical and recent labor force and earnings data for women and men from the Current Population Survey (CPS), a national monthly survey of approximately 60,000 households conducted by the U.S. Census Bureau for the U.S. Bureau of Labor Statistics. Unless otherwise noted, data are annual averages from the CPS.."

Women and Labor force

Monday, February 10, 2014

FAA hiring Air Traffic Controllers; Virtual Career Fair this Wednesday, February 12

"Today could be the day your dreams take flight. For the next two weeks, the Federal Aviation Administration is accepting applications for new Air Traffic Controllers for positions across the United States..."

FAA - air traffic controllers

Friday, February 7, 2014

Post-Employment, “Revolving Door,” Laws for Federal Personnel

"Federal personnel may be subject to certain conflict of interest restrictions on private employment
activities even after they leave service for the United States government. These restrictions—
applicable when one enters private employment after having left federal government service—are
often referred to as “revolving door” laws. For the most part, other than the narrow restrictions
specific to procurement officials or bank examiners, these laws restrict only certain
representational types of activities for private employers, such as lobbying or advocacy directed
to, and which attempt to influence, current federal officials..."
Revolving door employment

Monday, September 9, 2013

Disparities in STEM Employment by Sex, Race, and Hispanic Origin

"One focus area for increasing the STEM workforce has  been to reduce disparities in STEM employment by sex,  race, and Hispanic origin. Historically, women, Blacks,  and Hispanics have been underrepresented in STEM
employment..."
STEM Employment

Friday, September 6, 2013

Job Patterns For Minorities And Women In Private Industry

"As part of its mandate under Title VII of the Civil Rights Act of 1964, as amended, the Equal Employment Opportunity Commission requires periodic reports from public and private employers, and unions and labor organizations which indicate the composition of their work forces by sex and by race/ethnic category.."
Job Patterns for Minorities and Women

Tuesday, March 12, 2013

Job Openings and Labor Turnover Survey

Although the number of jobs created each month is a closely watched report, to get a more
complete one needs to look at the monthly "Job Openings and Labor Turnover Survey."
Here you will find the number of job openings, hires, and separations.
Job Openings and Labor Turnover Survey

Wednesday, October 10, 2012

Field of Degree and Earnings by Selected Employment Characteristics:2011

An examination of the relationship between the field of study or major of bachelor's degrees,  earnings, and employment characteristics for those aged 25 and older.
 Field of Degree and Earnings by Selected Empoyment Characteristics:2011

Wednesday, October 3, 2012

Geographic Profile of Employment and Unemployment

"The Geographic Profile of Employment and Unemployment (GP) contains information from the Current Population Survey (CPS) for census regions and divisions, the 50 States and the District of Columbia, and selected large metropolitan areas and cities. Data are provided on the employed and unemployed by selected demographic and economic characteristics.."
Geographic Profile of Employment and Unemployment

Friday, May 18, 2012

Regional and State Employment and Unemployment, April 2012

"The April 2012, nonfarm payroll employment increased in 32 states and the District of Columbia  and decreased in 18 states. The largest over-the-month increase in employment occurred in Indiana (+17,100), followed by Texas(+13,200),  and Georgia (+7,800). The largest over-the-month decrease in employment occurred in Maryland (-6,000), followed by Wisconsin (-5,900) and New Hampshire (-4,800). Hawaii experienced the largest over-the-month percentage increase in employment (+0.8 percent), followed by North Dakota (+0.7 percent) and Indiana (+0.6 percent)..."