Showing posts with label BLS. Show all posts

Saturday, September 9, 2023

New BLS Employment Projections: 3 Charts

"When you’re thinking about making a career change, what information do you look for? Most people want to know if that career is growing – is the demand for that type of work increasing or decreasing? Will there be more jobs of that type in the future or fewer?

That’s just one use among many for the employment projections data produced every year by the Bureau of Labor Statistics, or BLS. The employment projections give students, job seekers, workers, employers, researchers, policymakers and others a good idea of how the labor force will change, which industries are likely to see growth, how fast specific occupations will grow and more.

The 2022-2032 employment projections data were released on Sept. 6, showing that the economy is projected to add almost 4.7 million jobs from 2022 to 2032. Here are some of the highlights: 

1. Fastest growing occupational groups 

Healthcare growth is being driven by an aging population and a higher prevalence of chronic conditions. Combined with the healthcare practitioners and technical occupational group, healthcare occupations are projected to account for approximately 2 out of every 5 new jobs added to the economy from 2022 to 2032. Demand for information technology products and services are fueling the increase in the computer and mathematical occupational group. Community and social service occupations – including counselors, social workers, and religious workers – are often adjacent to healthcare, so some of this group’s growth will be associated with the robust growth that is expected among healthcare occupations.
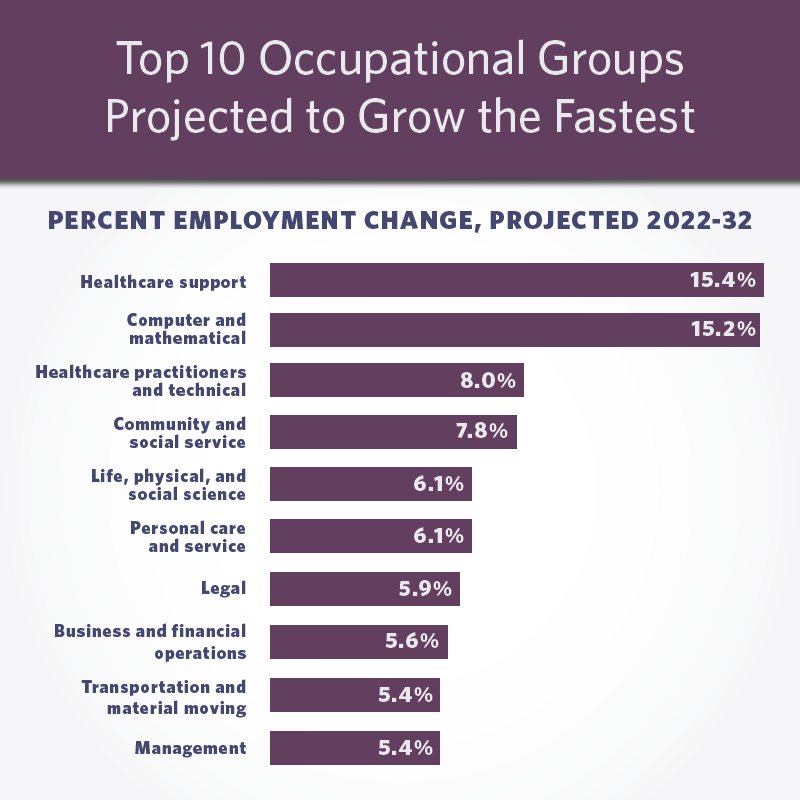
Chart showing the top 10 occupational groups projected to grow the fastest from 2022 to 2032. They include healthcare support (15.4%); computer and mathematical (15.2%); healthcare practitioners and technical (8.0%); community and social service (7.8%); life, physical and social science (6.1%); personal care and service (6.1%), legal (5.9%), business and financial operations (5.6%); transportation and material moving (5.4%); and management (5.4%).

Employment Projections 

Friday, April 21, 2023

Making Green: Good-Paying Jobs With an Environmental Focus

"For some workers, every day is Earth Day. Did you know studying how to protect the planet often leads to a good paycheck, too? 

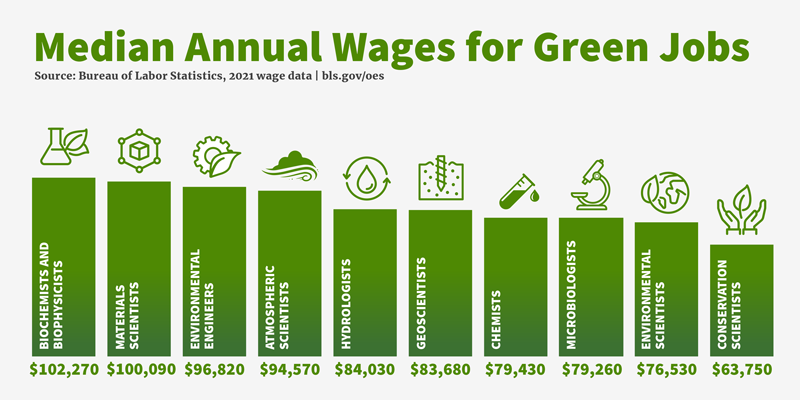
Data from the U.S. Bureau of Labor Statistics show that many scientists and engineers in green jobs had wages that were higher than the $45,760 median for all occupations in 2021. In addition, the bureau projects more than 30,000 openings overall each year, on average, from 2021 to 2031 for the 10 occupations shown below:

Bar chart showing median annual wages for 10 green jobs. Source: Bureau of Labor Statistics, 2021 wage data. bls.gov/oes.
Chart showing the 2021 median annual wages for 10 green jobs, ranging from $64,750 to $102,270..."
Green Jobs 

Saturday, April 23, 2022

Growing Jobs in Environmentally Focused Occupations

"If your career plan involves caring for the planet, there’s good news. The U.S. Bureau of Labor Statistics projects job growth in many occupations related to helping the environment or conserving natural resources.

In fact, two of the occupations that BLS projects to have the fastest employment growth from 2020 to 2030, wind turbine service technicians (68% increase) and solar photovoltaic installers (52% increase), involve “green” work. However, as the data show, the total number of new jobs is projected to be relatively small in these and some other green occupations.

Data chart on select green jobs with projected growth.

Chart 1 data below

Each of these occupations had a median annual wage that was higher than the $45,760 median for all workers in 2021. The typical education required to enter these occupations varies.

Workers in green occupations focus on the environment in different ways. Wind turbine service technicians and solar photovoltaic installers, for example, build and maintain systems that create energy from sources that don’t become depleted. Other workers help to monitor the environment and investigate sources of pollution. Still others advise organizations or individuals on ways to protect and preserve natural resources.

Tuesday, November 9, 2021

Veterans in the Labor Force: 6 Stats

"November is National Veterans and Military Families Month, when we honor and recognize the service of U.S. veterans. Here are six stats about veterans in the labor force you may not know.


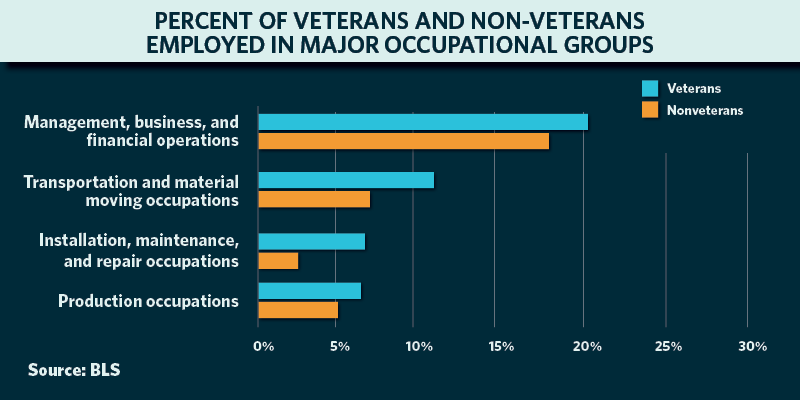
1. Four major occupational groups have higher concentrations of veterans than nonveterans.

Percent of veterans and nonveterans employed in selected occupational groups
Percent of veterans and nonveterans employed in selected occupational groups (plain text)

Following the Current Population Survey (CPS) occupational classification, out of the 10 major occupation groups, four have statistically higher concentrations of veterans than nonveterans (see Employment Situation of Veterans – 2020, Table 4).

For example, 11% of all veterans work in the transportation and material moving occupations group compared with 7% of nonveterans. 


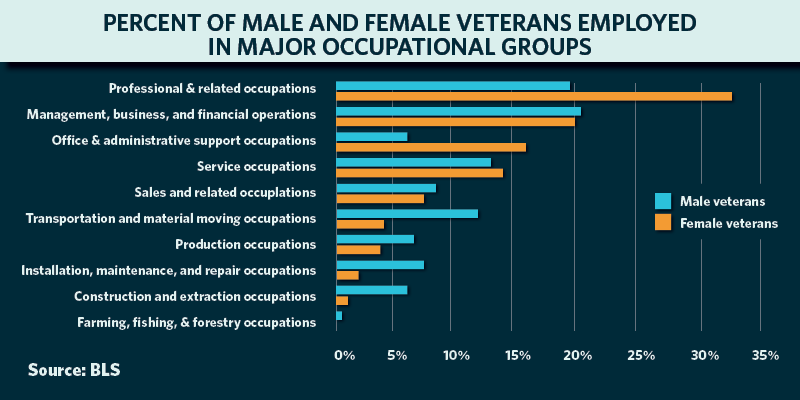
2. Two occupational groups have a higher concentration of women veterans than men.

Percentage of male and female veterans employed in major occupational groups.
Percent of male and female veterans employed in major occupational groups (plain text)

Women veterans have a statistically higher concentration than men veterans in professional and related occupations as well as office and administrative support occupations (see Employment Situation of Veterans – 2020, Table 4).."
Veterans labor force 

Wednesday, September 15, 2021

Hispanics in the Labor Force: 5 Facts

"The number of Hispanic workers contributing to our economy is growing steadily. The latest employment projections for 2020-2030 show substantial growth as well as higher labor force participation rates. Here are five facts to know:


29 million

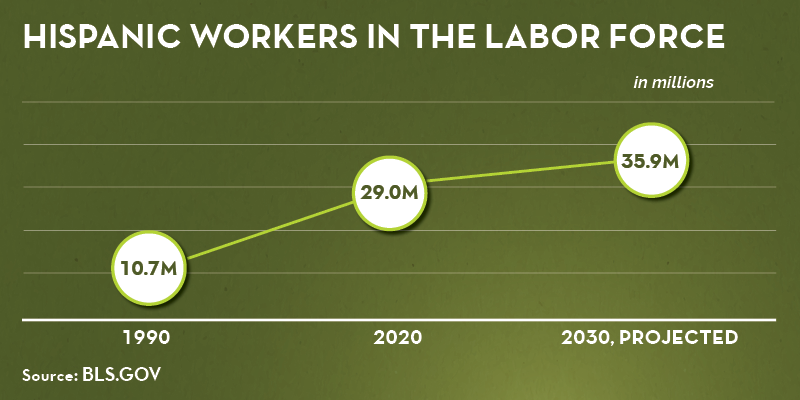
The number of Hispanic workers in the labor force has grown from 10.7 million in 1990 to 29.0 million in 2020 today, and is projected to reach 35.9 million in 2030.

Chart showing the number of Hispanic workers in the U.S. labor force. 1990: 10.7 million. 2020: 29.0 million. 2030, projected: 35.9 million. Source: bls.gov.


78%

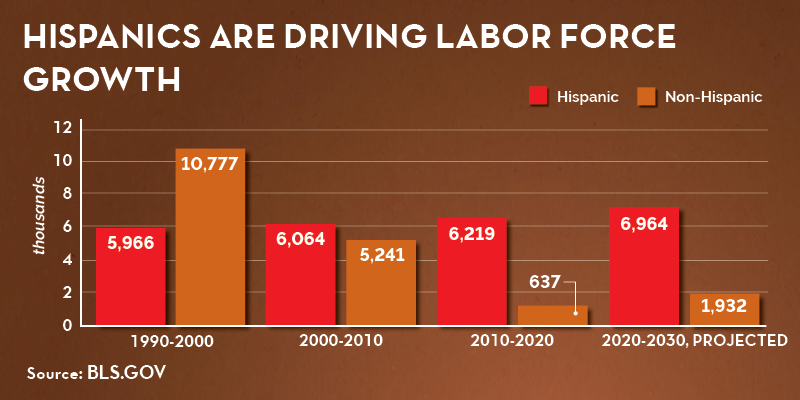
Hispanics are projected to account for 78% of net new workers between 2020 and 2030. The U.S. labor force growth rate has slowed over the past couple of decades – and what growth has occurred is largely due to the increasing number of Hispanic workers.

Non-Hispanic growth was negligible over the past 10 years, at just 0.5%. With Hispanic workers’ growth factored in, the nation’s overall labor force growth rate clocked in at 4.5%.

Chart showing how Hispanics are driving labor force growth in the U.S. labor force. From 1990-200, 5,966,000 Hispanic workers and 10,777,000 non-Hispanic workers joined the labor force. But then from 2000-2010, 6,064,000 Hispanics and 5,241,000 non-Hispanics joined. Then in 2010-2020, 6,219 Hispanics joined but only 637,000 non-Hispanics did. And BLS projects that from 2020-2030, 6,964,000 Hispanics will enter the labor force compared with only 1,932,000 non-Hispanics.


1 out of 5

As a share of the overall labor force, the gap between Hispanics and non-Hispanics is still large but shrinking. The Hispanic proportion of the workforce has increased from 8.5% in 1990 to 18.0% in 2020. In 2030, the Bureau of Labor Statistics projects Hispanics to account for 1 out of every 5 workers in the labor force, at 21.2%..."
Hispanic workers 

Tuesday, February 23, 2021

A More Inclusive Economy is Key to Recovery

"The unemployment rate dropped to 6.3% in January 2021, according to the latest Employment Situation report from the Bureau of Labor Statistics. Many workers are still in crisis and we know that the latest recession hasn’t affected everyone equally.

In addition to major disparities in health impacts, Black Americans have seen disproportionate economic impacts from the pandemic. Among demographic groups, Black women experienced the steepest drop in labor force participation and have had the slowest job recovery since January 2020. It took until 2018 for Black women’s employment to recover from the Great Recession, and now almost all of those hard-won gains have been erased.

In January 2021, 973,000 fewer Black women were employed than in February 2020, a decrease of 9.5% since the COVID-19 pandemic began. The losses in local and state government and leisure and hospitality have disproportionate impacts on Black women’s employment. Black women are nearly one in four public sector workers, and one in eight leisure and hospitality workers. Half a million Black women have left the labor market since January 2020...."
Black women employment 

Friday, September 4, 2020

Survey of Occupational Injuries and Illnesses

"The Injuries, Illnesses, and Fatalities (IIF) program at the Bureau of Labor Statistics reports a wide range of information about workplace injuries and illnesses.

IIF data can be separated into fatal and nonfatal data. Nonfatal data is gathered through the Survey of Occupational Injuries and Illnesses (SOII), a survey sent to private and public sector establishments each year, while the Census of Fatal Occupational Injuries (CFOI) provides a comprehensive count of all fatal workplace injuries.

Monday, December 23, 2019

CONSUMER EXPENDITURES--2018


"Average expenditures per consumer unit(1) for 2018 were $61,224, a 1.9-percent increase from 2017 levels, the U.S. Bureau of Labor Statistics reported today. During the same period the Consumer Price Index (CPI-U) rose 2.4 percent and average pretax income increased by 6.9 percent.

Nine of the 10 largest components of household spending increased during 2018.(See table A.) The 7.8-percent rise in personal insurance and pensions expenditures was the largest percentage increase among all major components, followed by a 2.5-percent rise in food. The only decrease among the largest components was a 5.6-percent drop in education spending..."
Consumer spending

Thursday, August 29, 2019

Consumer Expenditures Midyear Update: July 2017- June 2018

"Average expenditures per consumer unit(1) for July 2017 through June 2018 were up 4.0 percent compared with the July
2016 through June 2017 midyear average, the U.S. Bureau of Labor Statistics reported today. During the same period, 
the Consumer Price Index (CPI-U) rose 2.3 percent, and average pretax incomes increased 4.3 percent.


Table A. Average expenditures and income of all consumer units
_____________________________________________________________________________
                                                           Percent change      
                             July 2016-    July 2017-   July 2016 - June 2017
Item                         June 2017     June 2018            to
                              Average       Average     July 2017 - June 2018
---------------------------------------    ----------   ---------------------
Income before taxes            $73,207      $76,335              4.3
Average annual expenditures     58,460       60,815              4.0
  Food                           7,407        7,869              6.2
   Food at home                  4,121        4,445              7.9
   Food away from home           3,286        3,424              4.2
  Housing                       19,325       20,001              3.5
  Apparel and services           1,771        1,850              4.5
  Transportation                 9,252        9,735              5.2
  Healthcare                     4,710        4,924              4.5
  Entertainment                  2,941        3,379             14.9
  Education    1,372        1,505       9.7
  Cash contributions             2,088        1,840            -11.9
  Personal insurance and         6,938        6,904             -0.5
   pensions                                                  
   Pensions and Social           6,554        6,474             -1.2
   Security                   
  All other expenditures         2,655        2,808              5.8
____________________________________________________________________________
"

Consumer spending

Thursday, March 21, 2019

Labor force characteristics by race and ethnicity, 2017


"In 2017, the overall unemployment rate for the United States was 4.4 percent; however, the rate varied across race and ethnicity groups. Among the race groups, the unemployment rates were higher than the national rate for American Indians and Alaska Natives (7.8 percent), Blacks or African Americans (7.5 percent), people categorized as being of Two or More Races (6.7 percent), and Native Hawaiians and Other Pacific Islanders (6.1 percent). Jobless rates were lower than the national rate for Asians (3.4 percent) and Whites (3.8 percent). The rate for people of Hispanic or Latino ethnicity, at 5.1 percent, was higher than the 4.2-percent rate for non-Hispanics.

Labor market differences among the race and ethnicity groups are associated with many factors, not all of which are measurable. These factors include variations in educational attainment across the groups; the occupations and industries in which the groups work; the geographic areas of the country in which the groups are concentrated, including whether they tend to reside in urban or rural settings; and the degree of discrimination encountered in the workplace.

This report describes the labor force characteristics and earnings patterns among the largest race and ethnicity groups living in the United States—Whites, Blacks, Asians, and Hispanics—and provides detailed data through a set of supporting tables. The report also contains a limited amount of data on American Indians and Alaska Natives, Native Hawaiians and Other Pacific Islanders, people who are of Two or More Races, detailed Asian groups, and detailed Hispanic groups. Because of their relatively small sample sizes, estimates for these additional groups are not included in all tables..."
Labor force

Women in the Labor Force: 2017

"In 2017, 57.0 percent of all women participated in the labor force. This was slightly above the 56.8 percent who participated in 2016, but still 3 percentage points below the peak of 60.0 percent in 1999. By comparison, the labor force participation rate for men was 69.1 percent in 2017, essentially unchanged from the previous year and 17.5 percentage points below its peak of 86.6 percent in 1948.

The rapid rise in women’s labor force participation was a major development in the labor market during the second half of the 20th century. Overall, women’s labor force participation increased dramatically from the 1960s through the 1980s, before slowing in the 1990s. After reaching a peak in 1999, labor force participation among women began a gradual decline. This decline accelerated following the Great Recession of 2007–09 until the participation rate hit a recent low in 2015 at 56.7 percent..."
Women labor

Geographic Profile of Employment and Unemployment, 2017

"Geographic Profile of Employment and Unemployment, 2017 is available in one downloadable file containing all 26 data tables for census regions and divisions and states (XLSX), as well as individual tables below.."
Employment & unemployment

Occupational Outlook Handbook: 2019

"The OOH can help you find career information on duties, education and training, pay, and outlook for hundreds of occupations..."
Occupational outlook handbook

Thursday, October 26, 2017

EMPLOYMENT PROJECTIONS — 2016-26

"Employment is projected to increase by 11.5 million over the 2016-26 decade, an increase from 156.1 million to 167.6 million, the U.S. Bureau of Labor Statistics reported today. This growth—0.7 percent annually—is faster than the 0.5 percent rate of growth during the 2006–16 decade, a period heavily affected by the 2007–09 recession. Health care industries and their associated occupations are expected to account for a large share of new jobs projected through 2026, as the aging population continues to drive demand for health care services. The labor force will continue to grow slowly and to become older and more diverse. The aging population is projected to result in a decline in the overall labor force participation rate over the 2016 to 2026 decade.>>"
Employment growth

Saturday, October 14, 2017

26.8 million Hispanics or Latinos in the U.S. labor force in 2016

"Americans celebrate Hispanic Heritage Month from September 15 to October 15. The month honors the contributions of Hispanic and Latino Americans to the history and culture of the United States. In 2016, there were 26.8 million Hispanics or Latinos in the U.S. labor force, nearly triple the 9.0 million in 1988. Hispanics or Latinos composed 16.8 percent of the labor force in 2016, up from 7.4 percent in 1988.

Hispanics or Latinos include people from many ethnic groups and cultures. The largest is Mexican Americans, who accounted for 61 percent of the Hispanic or Latino labor force in 2016, around the same share as in 1988. Cubans are the smallest group, accounting for about 4 percent of the Hispanic or Latino labor force in 2016, a slightly smaller share than in 1988..."
Hispanic labor force

Hispanic Women in the Workforce

"Each year, the United States recognizes Sept. 15 to Oct. 15 as Hispanic Heritage Month. In recognition of Hispanic women’s significant contributions to the labor force, here are six statistics demonstrating their growing influence as drivers of economic productivity and entrepreneurs..."
Hispanic women workers

Tuesday, September 19, 2017

5 Facts About Working Women and Retirement

"1) Women live longer but often have less saved for retirement.
You probably knew women tend to live a little longer than men, but did you know they also tend to have less saved for retirement? On average, a woman retiring at age 65 can expect to live another 21 years, nearly three years longer than a man retiring at the same age. The median balance of women’s retirement accounts in 2016 was only $20,680 compared to $31,371 for men, as reported by Vanguard.
2) Many women aren’t saving for retirement at work.
Approximately 54 percent of working women are not participating in an employer-sponsored retirement plan either by choice (7 percent), ineligibility (9 percent), or because none was offered (37 percent), according to the National Institute for Retirement Security.
3) Mothers’ wages are increasingly important to the economic security of their families.
Almost 60 percent of all women over age 16 were in the workforce in 2015. For mothers with children under 18, the participation rate jumps to nearly 70 percent. Additionally, the number of mothers who are the sole or primary earner has increased significantly in the past few decades. Mothers provide at least half of the family’s income in 40.9 percent of households with children under age 18, up from 11.3 percent in 1960.
4) Mothers are nearly five times more likely to work part-time than fathers.
Despite strides in women’s earnings over the past decades, employed mothers are nearly five times more likely to work part-timethan fathers, due in part to caregiving duties. Part-time workers are less likely to be covered by an employer-provided retirement savings plan, and may have less money to save on their own.
5) Women are at greater risk of experiencing poverty in retirement.
Women face a higher risk of poverty in retirement and are much more likely than men to depend on Social Security payments. For 27.4 percent of women age 65 and over, Social Security benefits comprise 90 percent of their total income. Forty-six percent of all elderly unmarried women (including widows) who received Social Security benefits in 2014 relied on it for 90 percent or more of their income..."

Working women

Wednesday, August 23, 2017

Profile of the labor force by educational attainment

"Increased education is associated with both higher wages and lower unemployment. This Spotlight on Statistics highlights how that relationship has changed over time and examines additional detail on educational attainment.
The charts and analysis that follow illustrate historical and current statistics from the Current Population Survey on the U.S. labor force for people age 25 years and older by educational attainment, defined as the highest diploma or degree received at the time the survey was conducted..."

Labor force and education

Thursday, June 15, 2017

By the Numbers: Spending Habits of Older Americans

"It’s no secret that people’s needs and spending habits change over time. For Older Americans Month, we took a look into the data to highlight some of the spending changes.  Check out these Consumer Expenditure Survey fast facts and see how your spending stacks up to those of the older generation:
  • Older households are more apt to be homeowners (79 percent) than younger households (57 percent). Please note: By “older households,” we mean those with a reference person (often the principal homeowner or renter) 65 years and older, and by “younger households” we mean those with a reference person under 65 years.
  • Housing is the greatest expense, both in dollar amount ($15,529) and as a share of the household budget (34.8 percent) among older households.
  • Older and younger households are similar in that 85 percent of older households and 88 percent of younger households own or lease at least one vehicle.
  • Transportation expenses among older households, however, are lower in dollar amount ($6,846) and as a share of the household budget (15.3 percent) compared with younger households ($10,310 and 17.4 percent, respectively). That’s probably because older households have fewer earners and would be less likely to have job-related transportation costs.
  • Because older households have fewer earners, pensions and Social Security costs are much lower in dollar amount ($2,401) and as a share of the household budget (5.4 percent) among older households compared with younger households ($7,118 and 12 percent).
  • Out-of-pocket healthcare expenses are higher in dollar amount ($5,766) and as a share of the household budget (12.9 percent) among older households compared with younger households ($3,912 and 6.6 percent)...."

Older Americans and spending

Wednesday, June 7, 2017

Celebrating 97 Years of Advocacy for Working Women

"First created during World War I to study women’s employment during and after the war, the Women’s Bureau became a permanent federal government fixture in 1920. Ninety-seven years later, the Bureau remains the sole federal agency designed to advocate on behalf of working women.
Since its inception, the bureau has supported innovative policies and programs designed to address emerging issues affecting working women and create a positive environment for working women and their families.
Women have made great progress over the course of the bureau’s 97-year history, as seen in higher education levels and higher earnings. As it has for nearly a century, the Women’s Bureau will continue working to address the challenges working women experience and raise awareness on key issues and developments affecting women in the workforce
Tracie Sanchez is a policy analyst for the Women’s Bureau.
Editor's note: Photo credits clockwise from top left - Library of Congress, U.S. Labor Department, Library of Congress, Library of Congress and the National Archives


Working Women