Wednesday, April 28, 2021

Interim Public Health Recommendations for Fully Vaccinated People

"Summary of Recent Changes

  • Guiding principles for fully vaccinated people are now provided.
  • Underscores that immunocompromised people need to consult their healthcare provider about these recommendations, even if fully vaccinated.
  • Fully vaccinated people no longer need to wear a mask outdoors, except in certain crowded settings and venues.
  • Clarification that fully vaccinated workers no longer need to be restricted from work following an exposure as long as they are asymptomatic.
  • Fully vaccinated residents of non-healthcare congregate settings no longer need to quarantine following a known exposure.
  • Fully vaccinated asymptomatic people without an exposure may be exempted from routine screening testing, if feasible.

Key Points

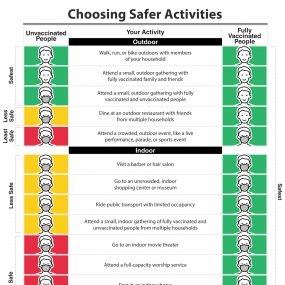
choosingSaferActivities

This set of public health recommendations for fully vaccinated people will be updated and expanded based on the level of community spread of SARS-CoV-2, the proportion of the population that is fully vaccinated, and the rapidly evolving science on COVID-19 vaccines.

For the purposes of this guidance, people are considered fully vaccinated for COVID-19 ≥2 weeks after they have received the second dose in a 2-dose series (Pfizer-BioNTech or Moderna), or ≥2 weeks after they have received a single-dose vaccine (Johnson and Johnson (J&J)/Janssen).±

± This guidance applies to COVID-19 vaccines currently authorized for emergency use by the U.S. Food and Drug Administration: Pfizer-BioNTech, Moderna, and Johnson and Johnson (J&J)/Janssen COVID-19 vaccines.  This guidance can also be applied to COVID-19 vaccines that have been authorized for emergency use by the World Health Organization (e.g. AstraZeneca/Oxford).

The following recommendations apply to non-healthcare settings. For related information for healthcare settings, visit Updated Healthcare Infection Prevention and Control Recommendations in Response to COVID-19 Vaccination.

Fully vaccinated people can:

  • Visit with other fully vaccinated people indoors without wearing masks or physical distancing
  • Visit with unvaccinated people (including children) from a single household who are at low risk for severe COVID-19 disease indoors without wearing masks or physical distancing
  • Participate in outdoor activities and recreation without a mask, except in certain crowded settings and venues
  • Resume domestic travel and refrain from testing before or after travel or self-quarantine after travel
  • Refrain from testing before leaving the United States for international travel (unless required by the destination) and refrain from self-quarantine after arriving back in the United States
  • Refrain from testing following a known exposure, if asymptomatic, with some exceptions for specific settings
  • Refrain from quarantine following a known exposure if asymptomatic
  • Refrain from routine screening testing if asymptomatic and feasible

For now, fully vaccinated people should continue to:

  • Take precautions in indoor public settings like wearing a well-fitted mask
  • Wear well-fitted masks when visiting indoors with unvaccinated people who are at increased risk for severe COVID-19 disease or who have an unvaccinated household member who is at increased risk for severe COVID-19 disease
  • Wear well-fitted masks when visiting indoors with unvaccinated people from multiple households
  • Avoid indoor large-sized in-person gatherings
  • Get tested if experiencing COVID-19 symptoms
  • Follow guidance issued by individual employers
  • Follow CDC and health department travel requirements and recommendations.."
    Recommendations for fully vaccinated
     

Apportionment and Redistricting Following the 2020 Census

"Updated April 27, 2021

The census, apportionment, and congressional redistricting are interrelated processes that occur every decade. The U.S. Constitution provides that a decennial census determines the distribution of U.S. House seats across states. Dividing House seats across states is known as apportionment (or reapportionment). Each state must receive one House seat and additional seats are distributed proportionally based on state population size. States then engage in redistricting, creating or redrawing geographic subdivisions with relatively equal-sized populations for each House district.

Timelines for the census and apportionment are provided in federal statute and generally occur as scheduled every decade. The Coronavirus Disease 2019 (COVID-19) pandemic, however, affected 2020 census field operations and delivery of apportionment figures, and concerns remain about timing for the redistricting processes that follow. This Insight provides background on the typical timing of the census, apportionment, and redistricting, as well as a brief discussion of recent census operational changes and proposals, particularly those related to congressional apportionment and redistricting.

Typical Timing—Census, Apportionment, and Redistricting
 
Figure 1 illustrates a timeline of the typical census, apportionment, and redistricting processes. Federal statute requires that April 1 of any year ending in “0” marks the official decennial census date. A count known as the apportionment population, which reflects the total resident population in each state, is typically used to distribute House seats. Within nine months of the decennial census date (December 31 of the year ending in “0”), the Secretary of Commerce is to report the apportionment population to the President; the Census Bureau has often released apportionment counts publicly at about the same time.

According to this timeline, within the first week of the first regular session of the next Congress, the President transmits a statement to Congress with information on how to apportion House seats. The President’s message contains the apportionment population and resulting number of Representatives for each state, based on the total number of Representatives (435) and using the method of equal proportions.

The Clerk of the House sends each governor a certificate indicating a state’s number of Representatives within 15 calendar days of receiving the President’s apportionment message. Each state receives the number of Representatives noted in the President’s statement, beginning at the start of the next session of Congress (typically, early January of a year ending in “3”). States may then engage in their own redistricting processes before the start of that Congress, and the timing of redistricting varies based on state laws..."
Apportionment and Redistricting 

Tuesday, April 27, 2021

Qui Tam: The False Claims Act and Related Federal Statutes

"Qui tam statutes enlist the public to sue to recover civil penalties and forfeitures from those who have defrauded the government. Qui tam rewards those who sue in the government’s name (called relators) with a portion of the recovered proceeds. A creature of antiquity, once common, today qui tam lives on in federal law only in the False Claims Act and in Indian protection laws.

The False Claims Act proscribes: (1) presenting a false claim; (2) making or using a false record or statement material to a false claim; (3) possessing property or money of the U.S. and delivering less than all of it; (4) delivering a certified receipt with intent to defraud the U.S.; (5) buying public property from a federal officer or employee, who may not lawfully sell it; (6) using a false record or statement material to an obligation to pay or transmit money or property to the U.S., or concealing or improperly avoiding or decreasing an obligation to pay or transmit money or property to the U.S.; or (7) conspiring to commit any such offense. Offenders face the prospect of costs, expenses, attorneys’ fees, damages, and perhaps triple damages in a civil action brought either by the U.S. or by a relator in the name of the U.S. Additional liability may flow from any retaliatory action taken against a False Claims Act whistleblower. The False Claims Act features a first-to-file bar that precludes copycat or piggyback relator suits and a public disclosure bar that precludes suits based on old news unless the relator is an original source.

If the government initiates the suit, others may not join. If the government has not brought suit, a relator may do so, but must give the government notice and afford it 60 days to decide whether to take over the litigation. If the government declines to intervene, a prevailing relator’s share of any recovery is capped at 30%; if the government intervenes, the cap is lower and depends upon the circumstances. Relators in Indian protection qui tam cases are entitled to half of the recovery..."
Qui Tam 

2020 Census Apportionment Results

"Apportionment is the process of dividing the 435 memberships, or seats, in the U.S. House of Representatives among the 50 states. At the conclusion of each decennial census, the results are used to calculate the number of seats to which each state is entitled. Each of the 50 states is entitled to a minimum of one seat in the U.S. House of Representatives.

The 2020 Census apportionment population includes the resident population of the 50 states, plus a count of the U.S. military personnel and federal civilian employees living outside the United States (and their dependents living with them) who can be allocated to a home state. The population of the District of Columbia is not included in the apportionment population.

The calculation methods used through most of the 20th century have been based upon the use of a mathematically determined priority listing of states. Adopted by Congress in 1941 and used each census thereafter, the method of equal proportions also results in a listing of the states according to a priority value—calculated by dividing the population of each state by the geometric mean of its current and next seats—that assigns seats 51 through 435. For more information, see Computing Apportionment.

Table 1. Apportionment Population and Number of Representatives by State: 2020 Census

xlsExcel[<1.0 MB]
pdfPDF[<1.0 MB]

Table 2. Resident Population for the 50 States, the District of Columbia, and Puerto Rico: 2020 Census

xlsExcel[<1.0 MB]
pdfPDF[<1.0 MB]

Table 3. Overseas Population for the 50 States and the District of Columbia: 2020 Census

xlsExcel[<1.0 MB]

2020 Census Apportionment

"The U.S. Census Bureau announced today that the 2020 Census shows the resident population of the United States on April 1, 2020, was 331,449,281.

The U.S. resident population represents the total number of people living in the 50 states and the District of Columbia. The resident population increased by 22,703,743 or 7.4% from 308,745,538 in 2010.

“The American public deserves a big thank you for its overwhelming response to the 2020 Census,” Secretary of Commerce Gina Raimondo said. “Despite many challenges, our nation completed a census for the 24th time. This act is fundamental to our democracy and a declaration of our growth and resilience. I also want to thank the team at the U.S. Census Bureau, who overcame unprecedented challenges to collect and produce high-quality data that will inform decision-making for years to come.”

“We are proud to release these first results from the 2020 Census today. These results reflect the tireless commitment from the entire Census Bureau team to produce the highest-quality statistics that will continue to shape the future of our country,” acting Census Bureau Director Ron Jarmin said. “And in a first for the Census Bureau, we are releasing data quality metrics on the same day we’re making the resident population counts available to the public. We are confident that today’s 2020 Census results meet our high data quality standards.” 

The new resident population statistics for the United States, each of the 50 states, the District of Columbia and Puerto Rico are available on census.gov

  • The most populous state was California (39,538,223); the least populous was Wyoming (576,851).
  • The state that gained the most numerically since the 2010 Census was Texas (up 3,999,944 to 29,145,505).
  • The fastest-growing state since the 2010 Census was Utah (up 18.4% to 3,271,616).
  • Puerto Rico's resident population was 3,285,874, down 11.8% from 3,725,789 in the 2010 Census..."
    2020 Census Apportionment
     

Monday, April 26, 2021

Drinking Water Week

"The risk of getting COVID-19 through drinking water, recreational water, or wastewater transmission is low. Get answers to other questions about COVID-19 and water.


Have you ever stopped to think about how many times a day you use water from a faucet? Learn more about 
where your drinking water comes from and what makes it safe to use during Drinking Water Week (May 2–8, 2021).

Drinking water refers to the water that comes out of our tap or bottled water. Every day, people rely on safe drinking water in many different ways, such as for handwashing, bathing, cooking, washing clothes, and drinking.

The United States has one of the safest drinking water supplies in the world. It’s important to know how water gets to our faucets and what makes it safe to use. Protecting our water sources is an ongoing challenge, but controlling wastewater discharges and repairing broken septic systems near drinking water sources can greatly reduce germs in our source water.

Drinking Water Week

Drinking Water Weekexternal icon is an annual observance sponsored by the American Water Works Associationexternal icon in May to recognize the critical role drinking water plays in our daily lives. This year’s theme, “There When You Need It,” highlights the work water professionals do around-the-clock to ensure high-quality drinking water is always available at your tap, right when you need it.

Keeping Tap Water Safe and Healthy

Over the last 100 years, many improvements in the health, success, and lifespan of the U.S. population can be linked to improvements in water quality. Providing safe drinking water was one of the most important public health achievements of the 20th century. Water treatment (methods to reduce germs or chemicals that cause illness) have helped ensure access to healthy and safe water for millions of Americans.

Government regulations have helped reduce pollution of the bodies of water that supply our drinking water systems over the years. However, treating water to kill or remove contaminants like harmful germs or chemicals is still critical to making sure that water is safe to drink. Drinking water can become contaminated:

  • In the original water source (for example, a river)
  • Through inadequate water treatment
  • In storage tanks
  • In drinking water distribution systems (the pipes that carry water to homes, businesses, schools, and other buildings).."
    Drinking water
     

Thursday, April 22, 2021

Travel Advisories

"As a first step in planning any trip abroad, check the Travel Advisories for your intended destination. You can see the world at a glance on our color-coded map.

Note that conditions can change rapidly in a country at any time. To receive updated Travel Advisories and Alerts, choose the method that works best for you at travel.state.gov/stayingconnected

For more details and FAQs about our safety and security information, please see travel.state.gov/travelsafely..."
Travel checklist 

Climate change and the 1991-2020 U.S. Climate Normals

"As soon as the 2021 New Year’s celebrations were over, the calls and questions started coming in from weather watchers: When will NOAA release the new U.S. Climate Normals? The Normals are 30-year averages of key climate observations made at weather stations and corrected for bad or missing values and station changes over time. From the daily weather report to seasonal forecasts, the Normals are the basis for judging how temperature, rainfall, and other climate conditions compare to what’s normal for a given location in today’s climate.

For the past decade, the Normals have been based on weather observations from 1981 to 2010. In early May, climate experts at NOAA’s National Centers for Environmental Information will be releasing an updated collection—hourly, daily, monthly, and annual Normals for thousands of U.S. locations, states, regions—based on the weather experienced from 1991 to 2020.

But what about global warming?

Alongside the questions about when the new Normals will be released (first week of May), we’ve gotten a lot of questions about the Normals and global warming. Is global warming affecting the Normals? (Yes). Are the Normals adjusted to “subtract out” global warming? (No.)  So the new normal reflects our changing climate? (Yes). Then how do we keep track of what used to be normal? (Different analyses.)

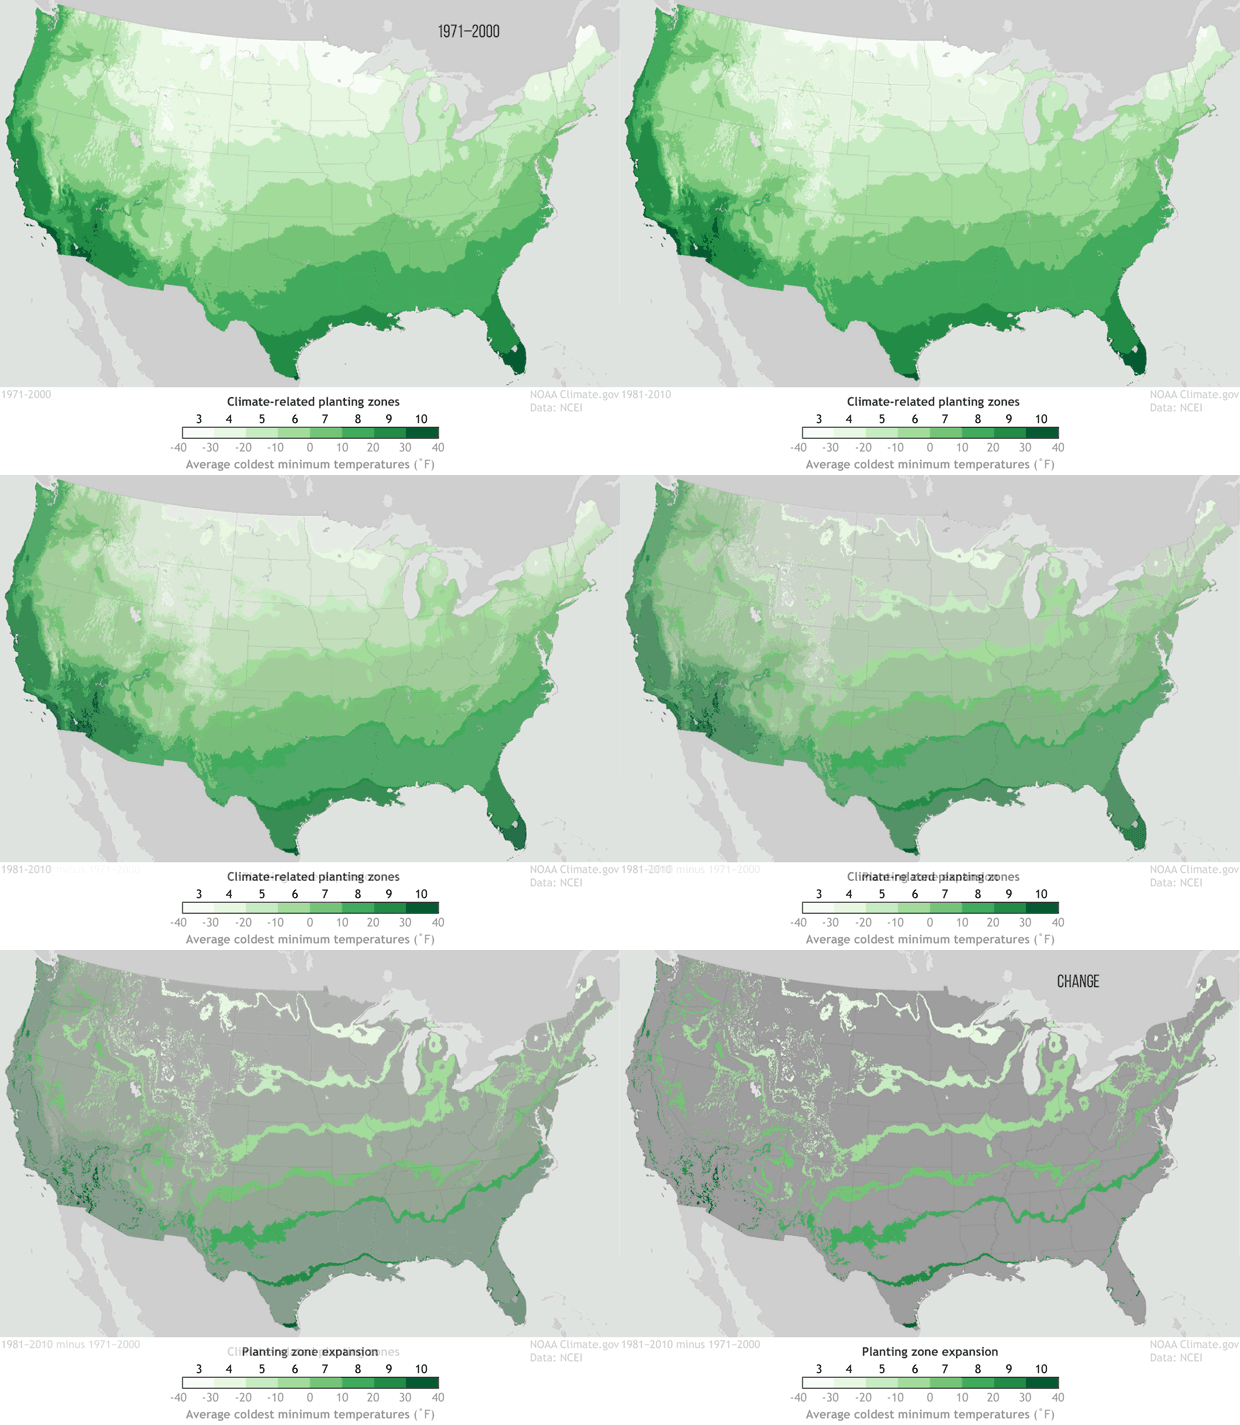
The last update of the Normals took place in 2011, when the baseline shifted from 1971-2000 to 1981-2010. Among the highlights of the rollout was the creation of a map showing how climate-related planting zones across the contiguous United States had shifted northward in latitude and upward in elevation. It was a clear signal that normal overnight low temperatures across the country were warmer than they used to be.

Changes in US plant zones between 1971-2000 Normals and 1981-2010 Normals

Changes in U.S. climate-related planting zones between the 1971-2000 Normals and the 1981-2010 Normals. Many places' coldest temperatures of the year grew warmer between the two periods, leading to a shift in plant hardiness zones. NOAA Climate.gov, based on data from NCEI. Explore an interactive map.

 The planting zone maps emphasized a key point about the Normals and climate change: the once-per-decade update means these products gradually come to reflect the “new normal” of climate change caused by global warming. What’s normal today is often very different than what was normal 50 or 100 years ago. This gradual adjustment is the point: the purpose of the Normals is to provide context on what climate is like today, not how it’s changing over time..."
Climate change 

Let’s Talk about Title IX

"What is Title IX?

Title IX of the Education Amendments of 1972 (“Title IX”) is a federal civil rights law that prohibits discrimination based on sex in any federally funded education program or activity. In other words, schools that receive federal funds are legally required to protect students against sex discrimination. Experiencing sex discrimination in any form can derail a student’s opportunity to learn, participate, and thrive in and outside of the classroom. Sex discrimination, including sexual harassment and sexual violence, is a threat to equal access to educational environments for students of all ages.

Why are we talking about it?

President Biden’s 2021 Executive Order on Guaranteeing an Educational Environment Free from Discrimination on the Basis of Sex, Including Sexual Orientation or Gender Identity requires ED to review and reconsider all Title IX regulations, including amendments made in 2020. ED is also required to issue new guidance and regulations as needed.

“Sexual harassment and all other forms of sex discrimination, including in extracurricular activities and other educational settings, threaten access to education for students of all ages. As Secretary, I will work to ensure all students—no matter their background, who they are, or how they identify—can succeed in the classroom and beyond. No matter the educational setting, students should feel safe and be able to focus on learning.” – Secretary Miguel Cardona.."
Title 1X 

Where the Green Jobs Grow

"Data

 Jobs  By: Bill Lawhorn • April 21, 2021

Illustration of a female environmental engineer holding a clipboard near a dam. The text says "Green Jobs With the Most Projected Openings, 2019-2029"

Looking for a new job or considering a career change? Passionate about the environment? Here are nine jobs you should know about. Out of the earth-friendly occupations with green related job duties discussed directly in the Bureau of Labor Statistics Occupational Outlook Handbook, these are projected to have among the most openings in the coming decade.


Environmental scientists and specialists

Environmental scientists and specialists use their knowledge of the natural sciences to protect the environment and human health. They may clean up polluted areas, advise policymakers, or work with industry to reduce waste.

2020 median pay: $73,230

Typical entry-level education: Bachelor's degree

Number of jobs: 90,900

Projected growth, 2019-2029: 7.8% (faster than average)

Occupational openings, 2019-29 annual average: 8,900


Chemists

Chemists specializing in green chemistry will design chemical processes and products that are environmentally sustainable. Green chemistry processes minimize the creation of toxins and waste, and might monitor environmental conditions at a chemical plant.

2020 median pay: $79,300

Typical entry-level education: Bachelor’s degree

Number of jobs: 86,700

Projected growth, 2019-2029: 4.7% (as fast as average)

Occupational openings, 2019-29 annual average: 7,300


Hazardous materials removal workers

Hazmat removal workers clean up materials that are harmful to people and the environment. The specific duties of hazmat removal workers depend on the substances that are targeted and the location of the cleanup.

2020 median pay: $45,270

Typical entry-level education: High school diploma or equivalent

Number of jobs: 45,300

Projected growth, 2019-2029: 8.2% (much faster than average)

Occupational openings, 2019-29 annual average: 5,600.."
Green Jobs