"As soon as the 2021 New Year’s celebrations were over, the calls and questions started coming in from weather watchers: When will NOAA release the new U.S. Climate Normals? The Normals are 30-year averages of key climate observations made at weather stations and corrected for bad or missing values and station changes over time. From the daily weather report to seasonal forecasts, the Normals are the basis for judging how temperature, rainfall, and other climate conditions compare to what’s normal for a given location in today’s climate.
For the past decade, the Normals have been based on weather observations from 1981 to 2010. In early May, climate experts at NOAA’s National Centers for Environmental Information will be releasing an updated collection—hourly, daily, monthly, and annual Normals for thousands of U.S. locations, states, regions—based on the weather experienced from 1991 to 2020.
But what about global warming?
Alongside the questions about when the new Normals will be released (first week of May), we’ve gotten a lot of questions about the Normals and global warming. Is global warming affecting the Normals? (Yes). Are the Normals adjusted to “subtract out” global warming? (No.) So the new normal reflects our changing climate? (Yes). Then how do we keep track of what used to be normal? (Different analyses.)
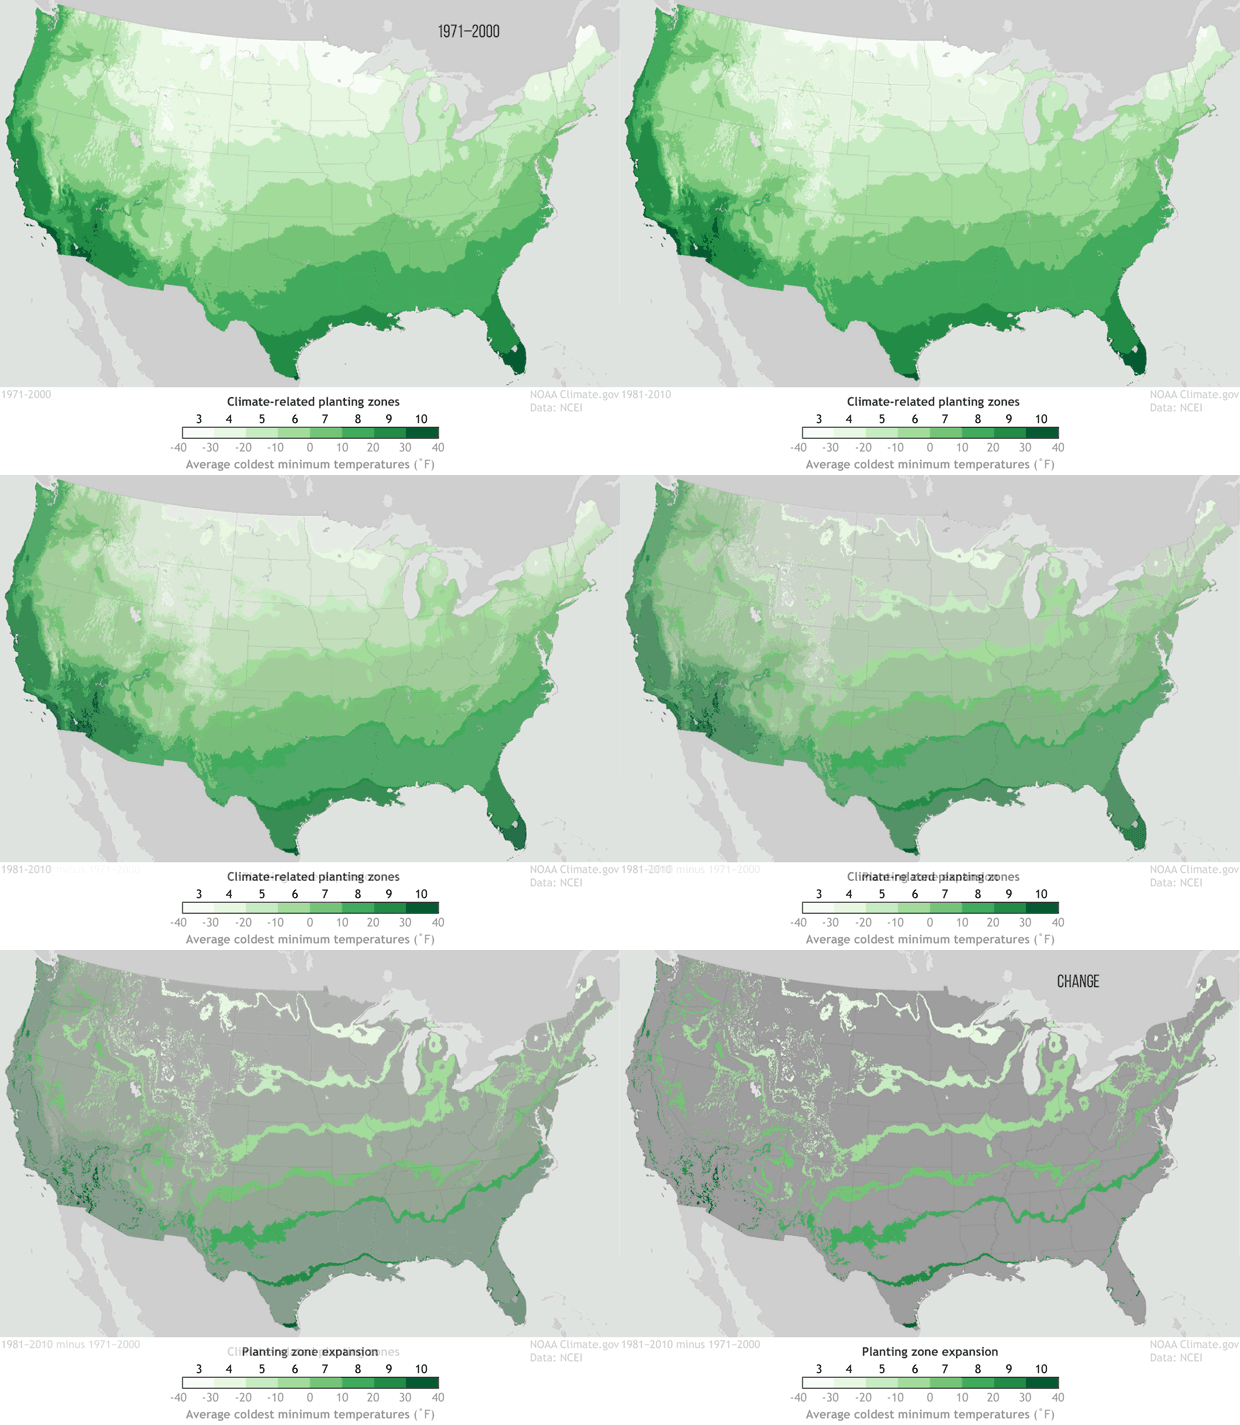
The last update of the Normals took place in 2011, when the baseline shifted from 1971-2000 to 1981-2010. Among the highlights of the rollout was the creation of a map showing how climate-related planting zones across the contiguous United States had shifted northward in latitude and upward in elevation. It was a clear signal that normal overnight low temperatures across the country were warmer than they used to be.

Changes in U.S. climate-related planting zones between the 1971-2000 Normals and the 1981-2010 Normals. Many places' coldest temperatures of the year grew warmer between the two periods, leading to a shift in plant hardiness zones. NOAA Climate.gov, based on data from NCEI. Explore an interactive map.
The planting zone maps emphasized a key point about the Normals and climate change: the once-per-decade update means these products gradually come to reflect the “new normal” of climate change caused by global warming. What’s normal today is often very different than what was normal 50 or 100 years ago. This gradual adjustment is the point: the purpose of the Normals is to provide context on what climate is like today, not how it’s changing over time..."
Climate change

No comments:
Post a Comment