Showing posts with label counties. Show all posts

Tuesday, March 19, 2024

More Counties Saw Population Gains in 2023

"MARCH 14, 2024 – More U.S. counties experienced population gains than losses in 2023, as counties in the South saw faster growth and more Northeast and Midwest counties had population losses turn to gains, according to the U.S. Census Bureau’s Vintage 2023 estimates of population and components of change released today.

Approximately 60% (1,876) of U.S. counties gained population from 2022 to 2023, an increase from the 52% of counties (1,649) that experienced population growth between 2021 and 2022. Among the nation's 3,144 counties, the average change from 2022 to 2023 was 0.29%, up from 0.17% the previous year.
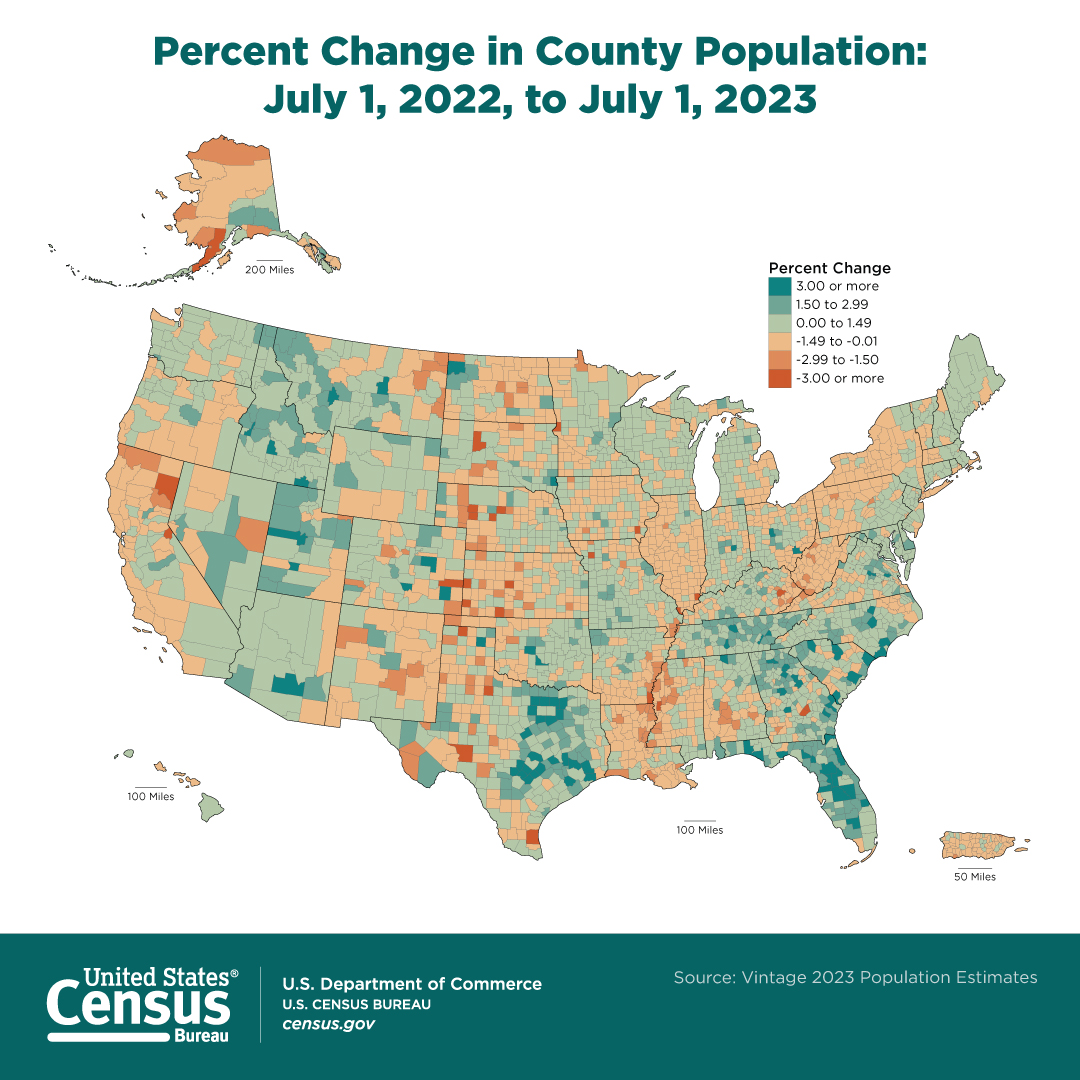
Percent Change in County Population: July 1, 2022, to July 1, 2023

“Domestic migration patterns are changing, and the impact on counties is especially evident,” said Lauren Bowers, chief of the Census Bureau’s Population Estimates Branch. “Areas which experienced high levels of domestic out-migration during the pandemic, such as in the Midwest and Northeast, are now seeing more counties with population growth. Meanwhile, county population growth is slowing down out west, such as in Arizona and Idaho.”

This was the first time since 2020 that more counties in the Midwest had population gains (542) than losses (513), narrowing the average annual change among the region's 1,055 counties to a loss of 0.02% from a loss of 0.09% a year earlier.."
County Population Estimates 2023i 

Friday, December 16, 2016

Census Bureau Releases 2015 Income and Poverty Estimates for All Counties

"Today, the U.S. Census Bureau released the latest findings from its Small Area Income and Poverty Estimates program. The program provides the only up-to-date, single-year income and poverty statistics for all counties and school districts — roughly 3,140 counties and over 13,000 school districts nationally.
The tables provide statistics on the number of people in poverty, the number of children younger than age 5 in poverty (for states only), the number of children ages 5 to 17 in families in poverty, the number of children younger than age 18 in poverty, and median household income. At the school district level, estimates are available for the total population, the number of children ages 5 to 17 and the number of children ages 5 to 17 in families in poverty.
These findings are a combination of the latest data from the American Community Survey with aggregate data from federal tax records, the Supplemental Nutrition Assistance ProgramBureau of Economic AnalysisSupplemental Security Incomedecennial censuses and the Population Estimates Program..."Income and poverty

Friday, December 11, 2015

Census Bureau Releases 2014 Income and Poverty Estimates for All Counties

"Today, the Census Bureau released the latest findings from its Small Area Income and Poverty Estimates program. The program provides the only up-to-date, single-year income and poverty statistics for all counties and school districts — roughly 3,140 counties and nearly 14,000 school districts nationally.
Tables provide statistics on the number of people in poverty, the number of children younger than age 5 in poverty (for states only), the number of children ages 5 to 17 in families in poverty, the number younger than age 18 in poverty, and median household income. At the school district level, estimates are available for the total population, the number of children ages 5 to 17 and the number of children ages 5 to 17 in families in poverty.
These estimates combine the latest data from the American Community Survey with aggregate data from federal tax records, the Supplemental Nutrition Assistance Program, decennial censuses and the Population Estimates Program.
According to the 2014 estimates:
  • Median household income at the county level in 2014 ranged from $21,658 to $125,635, with a median county level value of $45,229.
  • Based on poverty rate estimates for all 3,141 counties for all ages, 26 percent (820 counties) had a statistically significant increase in poverty between 2007 (the year before the most recent recession) and 2014. Only 1 percent of counties had a statistically significant decrease in poverty during that period..."
    Small area income and poverty

Wednesday, December 18, 2013

Northern Virginia Dominates List of Highest-Income Counties, Census Bureau Reports

"The U.S. Census Bureau reports that five of the counties or county-equivalents nationwide with the highest median household income in 2012 were located in Northern Virginia. Among them were Arlington County, at $99,255, Fairfax County, at $106,690, Falls Church (an independent city), at $121,250, Loudoun County, at $118,934, and Stafford County, at $95,927. Falls Church and Loudoun also had among the lowest poverty rates in the country..."
Median household income

Tuesday, April 30, 2013

County Business Patterns: 2011

Find economic data by industry at the county level for each state and the United States as a whole. Coverage includes the years 1998-2011.
County Business Patterns: 2011

Friday, August 24, 2012

Small Area Income and Poverty Estimates

Use a graphic resource to find income and poverty data for school districts, counties, and states.
The SAIPE program produces the following county and state estimates:
  • total number of people in poverty
  • number of children under age 5 in poverty (for states only)
  • number of related children ages 5 to 17 in families in poverty
  • number of children under age 18 in poverty
  • median household income

Tuesday, March 27, 2012

How do U.S. expenditures compare with those of other countries?

"In Japan, consumers spent more than 17 percent of every yen on groceries, more than twice the 8.3 percent of every dollar that Americans spent. In the United States, households spent almost 7 cents of every dollar on health care, compared with just 1.4 pence of every pound in the United Kingdom. This article compares how consumers in the United States, Canada, the United Kingdom, and Japan allocated different shares of total spending to categories such as food, housing, and transportation in 2009. Such variation can be expected, given differences in cultural tastes, the relative availability of goods and services, and institutional factors, such as government regulation and tax laws, among those countries. As shown in chart 1, housing and health care shares of total expenditures were higher in the United States than in Canada, the United Kingdom, and Japan in 2009, whereas Americans had the lowest clothing (or apparel) share. Canada had the highest clothing and transportation shares, and Japan had the highest food share, among the countries compared..."

Saturday, February 11, 2012

State and County Quick Facts

Find up-to-date information on people, busineses and geography by states and counties.

Monday, March 7, 2011

Saturday, December 11, 2010

U.S. Census Bureau Releases 2009 Income and Poverty Estimates for All Counties and School Districts
"Between 2007 and 2009, the poverty rate for children ages 5 to 17 in families rose in 295 counties and declined in 19 counties, according to U.S. Census Bureau estimates released today showing income and poverty in 2009 for every school district and county in the nation. However, in the majority of counties across the United States, the poverty rate for children ages 5 to 17 in families showed no statistically significant change between these years. By comparing the 2009 estimates released today with those from 2007, variations can be seen from data collected prior to the recession.

The 2009 Small Area Income and Poverty Estimates (SAIPE) are available for roughly 3,140 counties and nearly 14,000 Title I-eligible school districts. The 2009 estimates also show that 1,084 counties had child poverty rates (ages 5 to 17 in families) significantly above and 866 significantly below the national poverty rate of 18.2 percent..."

Tuesday, March 23, 2010

Metropolitan and County Population Estimates, 2009
"The latest estimates of total population for metropolitan and micropolitan statistical areas, counties, and Puerto Rico Municipios - for July 1, 2009 - were released March 2010."

Wednesday, December 23, 2009

County Compensation by Industry, 2008
"Compensation grew in over 80 percent of the 3,112 counties in the U.S., as the average annual compensation per job in the U.S. grew by 2.6 percent to $56,116, according to statistics released today by the U.S. Bureau of Economic Analysis (BEA).¹ Total compensation of U.S. workers grew 2.3 percent in 2008, as net job losses partially offset compensation growth. Inflation measured by the national price index for personal consumption expenditures, grew 3.3 percent..."

Wednesday, November 18, 2009

Census Bureau Releases 2008 Income and Poverty Estimates for All School Districts and Counties
"The U.S. Census Bureau today released 2008 income and poverty estimates
for every school district and county in the nation. These data,
part of the Small Area Income and Poverty Estimates (SAIPE) program,
currently represent the only source of Census Bureau income and
poverty data for each of the nation's 3,142 counties and almost 14,000
Title I-eligible school districts.

SAIPE is the only source of single-year income and poverty data for
approximately 1,300 counties and 76 percent of school districts.
Data for areas with population size of less than 20,000 are not expected to
be available from the American Community Survey (ACS)
until late 2010...."

Friday, March 27, 2009

Population Change in Central and Outlying Counties of Metropolitan
Statistical Areas: 2000 to 2007

"This report examines population change and the demographic components of change from 2000 to 2007 for central and outlying counties of metropolitan statistical areas. Population change in metro areas and their component central and outlying counties will be examined through the configurations of census regions and divisions, metro area population size categories, and 12 of the most populous metro areas. Demographic
components of change are births, deaths, and migration. The difference between the birth and death components is termed natural increase, and the migration component can consist of both net international migration and net domestic migration. Data used in this report come from the U.S. Census Bureau’s Population Estimates Program.

The report focuses on metro areas and the central and outlying counties that
compose the areas—all metro area counties belong to one of these two categories,
as defined by the Office of Management and Budger..."