Showing posts with label Census_Bureau. Show all posts

Monday, May 6, 2024

Justice Outcomes Explorer (JOE)

"The Justice Outcomes Explorer (JOE) is a Census Bureau experimental data product that measures the economic and health outcomes of people who have been involved with the criminal justice system.

Criminal justice involvement can include criminal charges, prison releases, and probation and parole sentences. Outcomes measured include employment, earnings, government program participation, and mortality.

JOE is a collaboration between the U.S. Census Bureau and the University of Michigan that uses Criminal Justice Administrative Records System (CJARS) data to better understand how people involved in the justice system reintegrate into society.

JOE covers criminal justice system involvement at any point between 2000 and 2020. Actual coverage of justice involvement depends on the coverage of agencies in the CJARS data, while coverage of outcomes depends on the availability of source data at the Census Bureau.

Data users can download JOE data below or interact directly with the JOE data using the data visualization tool hosted by the University of Michigan. The tool includes additional justice-related outcomes created from CJARS without Census Bureau data..."
Justice Outcomes Explorer 
Tuesday, April 16, 2024

New Report on the Nation’s Foreign-Born Population

"April 9, 2024 — From 2010 to 2022, the nation’s foreign-born population increased by 15.6%. According to a new report The Foreign-Born Population in the United States: 2022 released by the U.S. Census Bureau today, the foreign-born population was 46.2 million (13.9% of the total population) in 2022 compared to 40.0 million (12.9% of the total population) in 2010.

The report compares 2010 and 2022 American Community Survey (ACS), 1-year estimates to provide insight into the changing composition of the foreign-born population in the United States. The foreign-born population consists of anyone living in the United States who was not a U.S. citizen at birth, including naturalized U.S. citizens, lawful permanent residents (immigrants), temporary migrants such as foreign students, humanitarian migrants (for example, refugees and asylees) and unauthorized migrants.

Other highlights from the report:

  • From 2010 to 2022, the total foreign-born population increased by 15.6%. In Delaware, North Dakota, South Dakota and West Virginia, the foreign-born populations grew by 40% or more.
  • From 2010 to 2022, the median age of the foreign-born population increased by over 5 years (from 41.4 to 46.7), while the median age of the native population rose by only 1 year (from 35.9 to 36.9).
  • A higher percentage of foreign-born individuals completed high school or higher in 2022 (75.1%) than in 2010 (68.3%).

The Census Bureau also released a data visualization, Highlights of the Foreign-Born Population, and related America Counts story, Where Do Immigrants Live? How Immigrants Have Dispersed Throughout the Country. These products feature 2018-2022 ACS, 5-year estimates on the foreign-born population at various levels of geography (national, state and county).."
Foreign-Born Population 

Tuesday, March 19, 2024

More Counties Saw Population Gains in 2023

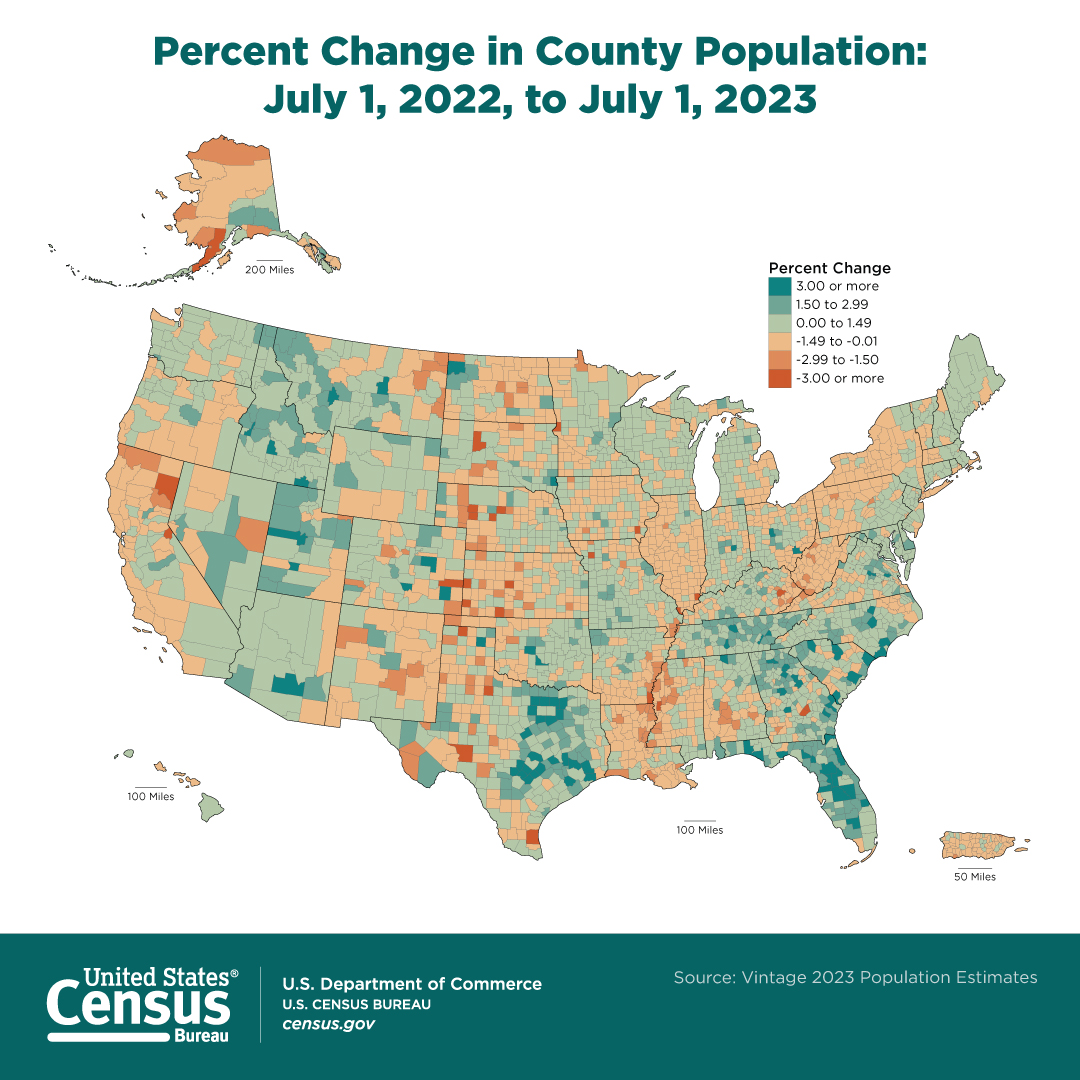
"MARCH 14, 2024 – More U.S. counties experienced population gains than losses in 2023, as counties in the South saw faster growth and more Northeast and Midwest counties had population losses turn to gains, according to the U.S. Census Bureau’s Vintage 2023 estimates of population and components of change released today.

Approximately 60% (1,876) of U.S. counties gained population from 2022 to 2023, an increase from the 52% of counties (1,649) that experienced population growth between 2021 and 2022. Among the nation's 3,144 counties, the average change from 2022 to 2023 was 0.29%, up from 0.17% the previous year.

Percent Change in County Population: July 1, 2022, to July 1, 2023

“Domestic migration patterns are changing, and the impact on counties is especially evident,” said Lauren Bowers, chief of the Census Bureau’s Population Estimates Branch. “Areas which experienced high levels of domestic out-migration during the pandemic, such as in the Midwest and Northeast, are now seeing more counties with population growth. Meanwhile, county population growth is slowing down out west, such as in Arizona and Idaho.”

This was the first time since 2020 that more counties in the Midwest had population gains (542) than losses (513), narrowing the average annual change among the region's 1,055 counties to a loss of 0.02% from a loss of 0.09% a year earlier.."
County Population Estimates 2023i 

Thursday, January 25, 2024

2022 Economic Census First Look

"JAN. 25, 2024 – The U.S. Census Bureau today released new First Look estimates from the 2022 Economic Census. The economic census is the U.S. government’s official 5-year measure of employer businesses in the United States. It provides the most comprehensive business and economic data available at the national, state and local levels – and serves as the benchmark for current economic measures, such as the Gross Domestic Product and Producer Price Index.

“The 2022 Economic Census provides foundational information on the nation’s businesses and is a primary undertaking for the Census Bureau,” said Nick Orsini, associate director for Economic Programs. “For this cycle of the economic census, we combined years of experience conducting censuses with machine learning technology to create an adaptive collection instrument that helped respondents quickly and correctly identify their industry, products and services. The improved efficiencies this created in data collection resulted in more effective data review that directly contributed to our ability to produce these First Look estimates earlier than we have in the past.”

In 2022, the number of establishments with paid employees increased to just over 8.0 million, up from 7.6 million establishments in 2017 and 7.1 million establishments in 2012. These establishments employed 140.0 million employees with an annual payroll of $8.6 trillion dollars..."
2022 Economic Census
 

Friday, January 5, 2024

Census Bureau Projects U.S. and World Populations on New Year’s Day

"As the nation rang in the new year, the U.S. Census Bureau projected the U.S. population will be 335,893,238 at midnight EST, on Jan. 1, 2024. This represents an increase of 1,759,535 (0.53%) from Jan. 1, 2023, and 4,443,957 (1.34%) from Census Day (April 1) 2020.

In January 2024, the United States is expected to experience one birth every 9.0 seconds and one death every 9.5 seconds. Meanwhile, net international migration is expected to add one person to the U.S. population every 28.3 seconds. The combination of births, deaths and net international migration increases the U.S. population by one person every 24.2 seconds.

The projected world population on Jan.1, 2024, is 8,019,876,189, an increase of 75,162,541 (0.95%) from New Year’s Day 2023. During January 2024, 4.3 births and 2.0 deaths are expected worldwide every second.

The Census Bureau’s Population Clock displays simulated real-time growth of the U.S. and world populations.."
Population Estimates


Friday, September 22, 2023

Census Bureau Releases 2020 Census Data for Nearly 1,500 Detailed Race and Ethnicity Groups, Tribes and Villages

"SEPTEMBER 21, 2023 — The U.S. Census Bureau today released 2020 Census population counts and sex-by-age statistics for 300 detailed race and ethnic groups, as well as 1,187 detailed American Indian and Alaska Native (AIAN) tribes and villages.

These data come from the 2020 Census Detailed Demographic and Housing Characteristics File A (Detailed DHC-A). Previously, the Census Bureau released 2020 Census data on the Hispanic or Latino population and major race groups such as White, Black or African American, Asian, etc.

Today’s release adds information on detailed groups within those major categories such as German, Lebanese, Jamaican, Chinese, Native Hawaiian and Mexican — and on AIAN tribes and villages like the Navajo Nation. The release includes information about more than 200 detailed race and ethnic groups not tabulated from previous censuses.

“These 2020 Census data illuminate the rich diversity across our nation,” said Rachel Marks, chief of the Census Bureau’s Racial Statistics Branch. “We have this comprehensive picture thanks to the millions of people who responded to the census and provided their detailed racial, ethnic or tribal identity, and thanks to the stakeholders, researchers and tribal leaders who helped us improve how we collect these detailed data.”

Data Highlights

Among the highlights, the Detailed DHC-A reveals the largest detailed groups within the major race groups and the Hispanic population. For the race groups, data are available for both the race alone population and the race alone or in any combination population. The race alone population represents the minimum number of people who identified as that group. It includes those who reported only one response, such as only Fijian. The race alone or in any combination population represents the maximum number of people who identified as that group. It includes those who reported only one response, such as Fijian, and those who reported multiple responses, such as Fijian and Japanese or Fijian and Black or African American.>>"
2020 Census Detailed Race and Ethnicity Groups 

Friday, January 13, 2023

Measuring Household Experiences during the Coronavirus Pandemic

Household Experience "Wht is the at is the Household Pulse Survey?

The U.S. Census Bureau, in collaboration with multiple federal agencies, is in a unique position to produce data on the social and economic effects of coronavirus and other emergent issues on American households. The Household Pulse Survey is designed to deploy quickly and efficiently, collecting data to measure household experiences during the coronavirus pandemic and recovery. Data will be disseminated in near real-time to inform federal and state response and recovery planning.

Tuesday, December 13, 2022

How to Access Retail Sales Data for the Nation and States


"Retail business owners, economists, and researchers will love discovering the retail data the Census Bureau has to offer. In this Data Gem, we demonstrate the Monthly State Retail Sales Tool, which easily allows you to compare year-over-year retail data by sector for national and state-level geographies..."
Retail sales data 

Tuesday, September 13, 2022

Income, Poverty and Health Insurance Coverage in the United States: 2021

"The U.S. Census Bureau announced today that real median household income in 2021 was not statistically different than 2020. The official poverty rate of 11.6% was also not statistically different between 2020 and 2021. The Supplemental Poverty Measure (SPM) rate in 2021 was 7.8%, a decrease of 1.4 percentage points from 2020. Meanwhile, the percentage of people with health insurance coverage for all or part of 2021 was 91.7% (compared to 91.4% in 2020.) An estimated 8.3% of people, or 27.2 million, did not have health insurance at any point during 2021, according to findings from the 2022 Current Population Survey Annual Social and Economic Supplement (CPS ASEC). That’s compared with an estimated 8.6% of people, or 28.3 million, who did not have health insurance at any point during 2020.

Real median household income was $70,784 in 2021, not statistically different from the 2020 estimate of $71,186. Income estimates are expressed in real or 2021 dollars to reflect changes in the cost of living. Between 2020 and 2021, inflation rose 4.7%; this is the largest annual increase in the cost-of-living adjustment since 1990. You can find more in-depth analysis in our recent Random Samplings blog.

The real median earnings of all workers (including part-time and full-time workers) increased 4.6% between 2020 and 2021, while median earnings of those who worked full-time, year-round decreased 4.1%. Between 2020 and 2021, the change in the number of total workers was not statistically significant; however, there was an increase of about 11.1 million full-time, year-round workers (from approximately 106.3 million to 117.4 million), suggesting a shift from part-time or part-year in 2020 to full-time, year-round work in 2021.

The official poverty rate in 2021 was 11.6%, with 37.9 million people in poverty. Neither the rate nor the number in poverty was significantly different from 2020. The SPM rate in 2021 was 7.8%, a decrease of 1.4 percentage points from 2020. This is the lowest SPM poverty rate since estimates were first published in 2009 and the third consecutive annual decline..."
Income, Poverty and Health Insurance 

Thursday, April 14, 2022

Census Bureau Releases New U.S. Population Estimates by Age and Sex

"APRIL 14, 2022 — The U.S. Census Bureau today released a downloadable file containing estimates of the nation’s resident population by sex and single year of age for July 1, 2021. It is available at <www.census.gov/programs-surveys/popest.html>. 

In the coming months, the Census Bureau will release additional  population estimates for cities and towns, as well as national, state and county population estimates by age, sex, race and Hispanic origin..."
Population by age and sex 

Tuesday, April 12, 2022

New Report on Undercount of Young Children in 2020 Census and Comparison to 2010

[The Census Project]

"A new report on the undercount of young children in the 2020 Census also provides a comparison between 2010 and 2020 Census efforts in counting young children. It “provides an overview of the research and new activities related to the net undercount of young children that occurred as planning for the 2020 Census began,” including “a review of new activity within the Census Bureau, mobilization of researchers and advocates on this issue outside the Census Bureau, and how the Census Bureau and the child advocacy community worked together on this problem.”

The report focuses “on the net undercount of young children in recent U.S. Censuses,” but notes that the “issue is bigger than the 2010 U.S. Census. Over the past 70 years, the U.S. Census has seen a consistently high net undercount of young children and there is an under-reporting of young children in major Census Bureau surveys…. Young children have high net undercounts in many other countries around the world…. In other words, this problem exists in many different cultures with different census-taking traditions. Despite changes in the U.S. Census Bureau methods over the past 70 years, as well as fundamental changes in U.S. society, the undercount of young children has remained high.”

Wednesday, March 30, 2022

Quick Summary of President’s FY 2023 Census Bureau Budget Request

[The Census Project]
"On March 28, President Biden released his Fiscal Year 2023 budget proposal. It includes $1.505 billion for the Census Bureau. The President’s request is a $151 million increase over the recently-enacted FY 2022 funding level for the Bureau ($1.354 billion). 
 
According to the White House release, this request includes $408 million “to finalize and evaluate the Decennial Census and lay the groundwork for a successful 2030 Census.”
 
The Census Bureau’s FY 2023 Congressional Justification provides more detail. Below are some highlights:

  • $153.4 million ($34 million over FY 2022) to support data collection related to the Economic Census and Census of Governments.
  • $235.6 million ($10 million over FY 2022) to support the American Community Survey (ACS), including an initiative to improve the measurement of sexual orientation and gender identity (SOGI) population in the ACS. 
  • $14.7 million increase in FY 2023 to support the High Frequency Data Program—an initiative that has emerged from the Bureau’s experimental Pulse Surveys. The request enables the Census Bureau to expand the program’s capabilities to provide “data and products quickly and more frequently in response to changing conditions in the economy and society.”
  • $8.4 million increase for Enterprise Data Dissemination, which includes funding for an initiative “to build evidence, evaluations, and improve underlying racial and ethnicity data.”
  • $68 million ($2.5 million increase over FY 2022) for all Household Surveys account, which funds the Current Population Survey and Survey of Income and Program Participation. Within this account, SIPP would receive a $1 million decrease over its FY 2022 level, while CPS would see an increase of approximately $4.5 million to develop and test a self-response web-based instrument.
  • $3.7 million increase in FY 2023 to support the Community Resilience Estimates (CRE) program that began during the pandemic to provide more granular population data. The Census Bureau plans to transition the program from focusing exclusively on the pandemic to address other disasters and “add data for steady state programs.”.."
    President Biden's 2023 Budget Request
     

Wednesday, March 2, 2022

U.S. Census Bureau Releases Key Stats in Honor of Women's History Month

"National Women’s History Month traces its roots to March 8, 1857, when women from various New York City factories staged a protest over poor working conditions. The first Women's Day celebration in the United States was in 1909, also in New York City. More than seven decades later, Congress in 1981 established National Women's History Week to be commemorated annually the second week of March. In 1987, Congress expanded the week to a month and every year since has passed a resolution (and the president has issued a proclamation) designating March Women’s History Month.

As we celebrate Women’s History Month 2022, we reflect upon advances women have made over the last decade. Women have increased their earnings, education and fields of occupation, and continue to have longer average life spans than men. Below are some Census Bureau stats highlighting these and other changes over the years. We appreciate the public’s cooperation in helping us measure America’s people, places and economy. 

Did You Know?

164.8 million

The number of females of all ages in the United States. There were 159.9 million males of all ages. 

2 to 1

The approximate ratio of women to men ages 85 and older (4.1 million to 2.2 million) in the United States. 

20.7%

In 2019, the percentage of women 25 and older with a bachelor’s degree as their highest degree; 19.9% of men had a bachelor’s degree as their highest degree.

80.8%

Women's median earnings as a percentage of men's median earnings, for full full-time, year-round workers 16 years and older.

More Stats

Saturday, January 8, 2022

U.S. Population Estimated at 332,403,650 on Jan. 1, 2022

"As our nation prepares to ring in the new year, the U.S. Census Bureau projects the United States population will be 332,403,650 on Jan. 1, 2022.

This represents a 0.21% increase in population or an additional 706,899 people since New Year’s Day 2021.
Population increased 0.29% since Census Day, April 1, 2020, adding 954,369 people during that period.

In January 2022, the United States is expected to experience a birth every nine seconds and one death every 11 seconds. Meanwhile, net international migration is expected to add one person to the U.S. population every 130 seconds.

The combination of births, deaths and net international migration increases the U.S. population by one person every 40 seconds.

The projected world population on Jan. 1, 2022 is 7,868,872,451, an increase of 74,235,487, or 0.95%, from New Year’s Day 2021

During January 2022, 4.3 births and 2.0 deaths are expected worldwide every second..."
U.S. Population
 

Thursday, September 23, 2021

Explore Census Data

"Explore Census Data

The Census Bureau is the leading source of quality data about the nation's people and economy.

Tables

Check out our new table display which allows you to dynamically add geographies, topics, or any applicable filters. You can reorder, pin, and hide columns all with simple drag and drop functionality. Tab through different tables to make sure you found the right one, customize it, and then download multiple vintages of it quickly. If you don’t see a functionality you need, find a bug, or have a comment, drop us a line at cedsci.feedback@census.gov.
VIEW TABLES

Thursday, August 12, 2021

2020 Census Statistics Highlight Local Population Changes and Nation’s Racial and Ethnic Diversity

"The U.S. Census Bureau today released additional 2020 Census results showing an increase in the population of U.S. metro areas compared to a decade ago. In addition, these once-a-decade results showed the nation’s diversity in how people identify their race and ethnicity.

“We are excited to reach this milestone of delivering the first detailed statistics from the 2020 Census,” said acting Census Bureau Director Ron Jarmin. “We appreciate the public’s patience as Census Bureau staff worked diligently to process these data and ensure it meets our quality standards."

These statistics, which come from the 2020 Census Redistricting Data (Public Law 94-171) Summary File, provide the first look at populations for small areas and include information on Hispanic origin, race, age 18 and over, housing occupancy and group quarters. They represent where people were living as of April 1, 2020, and are available for the nation, states and communities down to the block level.

The Census Bureau also released data visualizations, America Counts stories, and videos to help illustrate and explain these data. These resources are available on the 2020 Census results page. Advanced users can access these data on the FTP site.

Population Changes Across the Country Since the 2010 Census

Today’s release reveals changes in the size and distribution of the population across the United States. The population of U.S. metro areas grew by 9% from 2010 to 2020, resulting in 86% of the population living in U.S. metro areas in 2020, compared to 85% in 2010.

“Many counties within metro areas saw growth, especially those in the south and west. However, as we’ve been seeing in our annual population estimates, our nation is growing slower than it used to,” said Marc Perry, a senior demographer at the Census Bureau. “This decline is evident at the local level where around 52% of the counties in the United States saw their 2020 Census populations decrease from their 2010 Census populations.”

County and metro area highlights:

  • The largest county in the United States in 2020 remains Los Angeles County with over 10 million people.
  • The largest city (incorporated place) in the United States in 2020 remains New York with 8.8 million people.
  • 312 of the 384 U.S. metro areas gained population between 2010 and 2020.
  • The fastest-growing U.S. metro area between the 2010 Census and 2020 Census was The Villages, FL, which grew 39% from about 93,000 people to about 130,000 people.
  • 72 U.S. metro areas lost population from the 2010 Census to the 2020 Census. The U.S. metro areas with the largest percentage declines were Pine Bluff, AR, and Danville, IL, at -12.5 percent and -9.1 percent, respectively.

A data visualization released today shows the population change at the county level from the 2010 Census to the 2020 Census. Read more about population change in the America Counts story, More Than Half of U.S. Counties Were Smaller in 2020 Than in 2010.,,"
2020 Redistricting Data